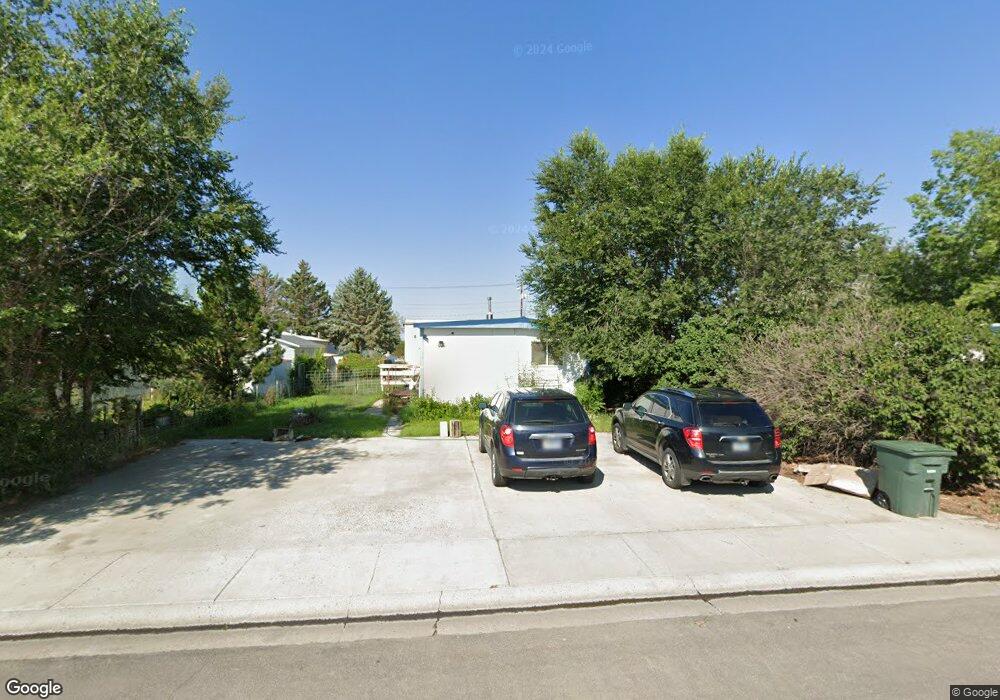
540 N Ingalls St Powell, WY 82435
Estimated Value: $926,000
--
Bed
--
Bath
--
Sq Ft
10,019
Sq Ft Lot
About This Home
This home is located at 540 N Ingalls St, Powell, WY 82435 and is currently estimated at $926,000. 540 N Ingalls St is a home located in Park County with nearby schools including Parkside Elementary School, Clark Elementary School, and Powell Middle School.
Ownership History
Date
Name
Owned For
Owner Type
Purchase Details
Closed on
Mar 31, 2025
Sold by
Gary Sweet And Laura K Coen Revocable Tr and Sweet Tracy
Bought by
Sweet Troy and Sweet Jamie
Current Estimated Value
Home Financials for this Owner
Home Financials are based on the most recent Mortgage that was taken out on this home.
Original Mortgage
$117,780
Outstanding Balance
$117,279
Interest Rate
6.87%
Mortgage Type
New Conventional
Estimated Equity
$808,721
Purchase Details
Closed on
Jan 25, 2019
Sold by
Severson Troy and Severson Trisha
Bought by
Sweet Gary
Home Financials for this Owner
Home Financials are based on the most recent Mortgage that was taken out on this home.
Original Mortgage
$80,000
Interest Rate
4.5%
Mortgage Type
New Conventional
Purchase Details
Closed on
Sep 27, 2005
Sold by
Cohn Harry D and Cohn Jane L
Bought by
Cohn Jane L
Purchase Details
Closed on
May 9, 2005
Sold by
Cohn Harry D and Cohn Jane L
Bought by
Cohn Jane L
Create a Home Valuation Report for This Property
The Home Valuation Report is an in-depth analysis detailing your home's value as well as a comparison with similar homes in the area
Home Values in the Area
Average Home Value in this Area
Purchase History
| Date | Buyer | Sale Price | Title Company |
|---|---|---|---|
| Sweet Troy | -- | First American Title | |
| Sweet Gary | -- | -- | |
| Cohn Jane L | -- | None Available | |
| Cohn Jane L | -- | None Available |
Source: Public Records
Mortgage History
| Date | Status | Borrower | Loan Amount |
|---|---|---|---|
| Open | Sweet Troy | $117,780 | |
| Previous Owner | Sweet Gary | $80,000 |
Source: Public Records
Tax History Compared to Growth
Tax History
| Year | Tax Paid | Tax Assessment Tax Assessment Total Assessment is a certain percentage of the fair market value that is determined by local assessors to be the total taxable value of land and additions on the property. | Land | Improvement |
|---|---|---|---|---|
| 2025 | $325 | $4,292 | $3,548 | $744 |
| 2024 | $400 | $5,283 | $4,505 | $778 |
| 2023 | $379 | $5,075 | $4,268 | $807 |
| 2022 | $340 | $4,548 | $3,888 | $660 |
| 2021 | $338 | $4,460 | $3,888 | $572 |
| 2020 | $339 | $4,443 | $3,888 | $555 |
| 2019 | $339 | $4,430 | $3,888 | $542 |
| 2018 | $337 | $4,404 | $3,888 | $516 |
| 2017 | $328 | $4,296 | $3,793 | $503 |
| 2016 | $323 | $4,341 | $3,793 | $548 |
| 2015 | -- | $3,856 | $3,318 | $538 |
| 2014 | -- | $3,845 | $3,318 | $527 |
Source: Public Records
Map
Nearby Homes
- 665 E 7th St
- 543 N Day St
- 868 E North St
- 665 N Day St
- 744 N Day St
- 853 N Day St Unit 66
- 529 Beartooth Dr
- 847 N Clark St
- 278 S Jones St
- 235 E 2nd St
- 668 N Bent St
- 139 E 7th St
- 445 N Absaroka St
- 247 N Bernard St
- 235 N Cheyenne St
- 1107 E Madison St
- 210 W 1st St
- 2 Powell Hwy
- 1142 E Madison St
- 1165 Van Place
- 552 N Ingalls St
- 510 N Ingalls St
- 835 E 5th St
- 560 N Ingalls St
- 574 N Ingalls St
- 576 N Ingalls St
- 472 N Ingalls St
- 525 N Ingalls St
- 820 E 5th St
- 535 N Ingalls St
- 545 N Ingalls St
- 584 N Ingalls St
- 555 N Ingalls St
- 485 N Ingalls St
- 485 N Ingalls St
- 557 N Hamilton St
- 808 E 5th St
- 442 N Ingalls St
- 565 N Ingalls St
- 455 N Hamilton St