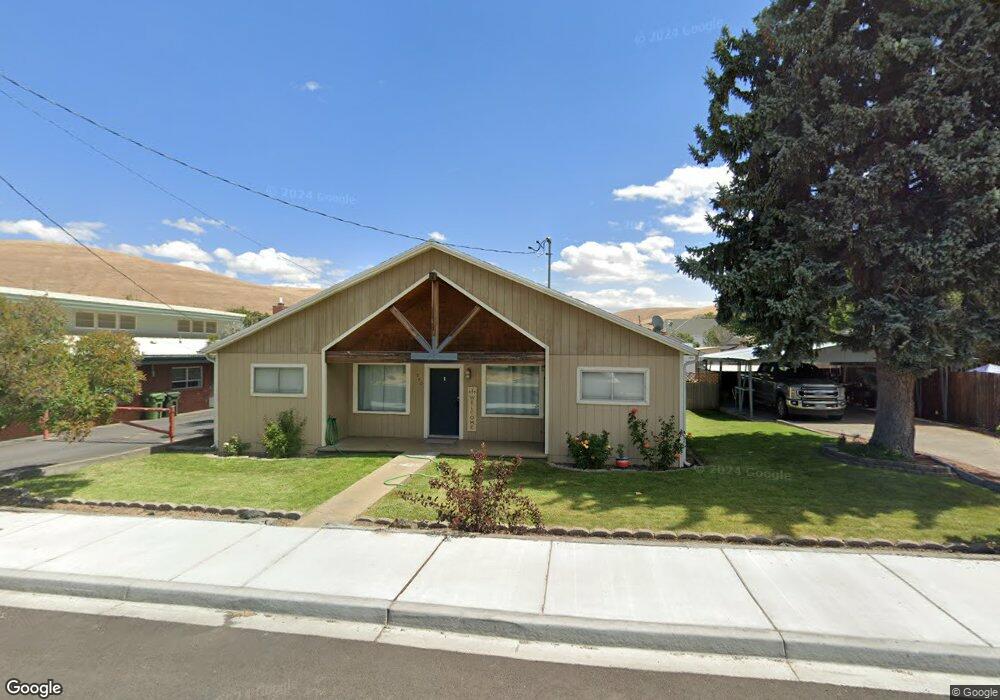
540 N Jones St Heppner, OR 97836
Estimated Value: $247,832 - $319,000
3
Beds
2
Baths
1,904
Sq Ft
$149/Sq Ft
Est. Value
About This Home
This home is located at 540 N Jones St, Heppner, OR 97836 and is currently estimated at $283,416, approximately $148 per square foot. 540 N Jones St is a home located in Morrow County with nearby schools including Heppner Elementary School and Heppner Junior/Senior High School.
Ownership History
Date
Name
Owned For
Owner Type
Purchase Details
Closed on
Jul 9, 2021
Sold by
Roy Jacob D
Bought by
Lazinka Shane Royce and Lazinka Regina Lee
Current Estimated Value
Home Financials for this Owner
Home Financials are based on the most recent Mortgage that was taken out on this home.
Original Mortgage
$207,000
Outstanding Balance
$187,413
Interest Rate
2.9%
Mortgage Type
New Conventional
Estimated Equity
$96,003
Purchase Details
Closed on
Nov 3, 2014
Sold by
Roy Josh and Roy Jessica J
Bought by
Roy Jacob D
Home Financials for this Owner
Home Financials are based on the most recent Mortgage that was taken out on this home.
Original Mortgage
$121,428
Interest Rate
4.17%
Mortgage Type
New Conventional
Purchase Details
Closed on
Nov 17, 2005
Sold by
Roy Josh and Maben Jessica
Bought by
Roy Josh and Roy Jessica J
Home Financials for this Owner
Home Financials are based on the most recent Mortgage that was taken out on this home.
Original Mortgage
$63,626
Interest Rate
5.97%
Mortgage Type
FHA
Create a Home Valuation Report for This Property
The Home Valuation Report is an in-depth analysis detailing your home's value as well as a comparison with similar homes in the area
Home Values in the Area
Average Home Value in this Area
Purchase History
| Date | Buyer | Sale Price | Title Company |
|---|---|---|---|
| Lazinka Shane Royce | $230,000 | Mid Columbia Title Company | |
| Roy Jacob D | $120,000 | Mid-Columbia Title Company | |
| Roy Josh | -- | -- |
Source: Public Records
Mortgage History
| Date | Status | Borrower | Loan Amount |
|---|---|---|---|
| Open | Lazinka Shane Royce | $207,000 | |
| Previous Owner | Roy Jacob D | $121,428 | |
| Previous Owner | Roy Josh | $63,626 |
Source: Public Records
Tax History Compared to Growth
Tax History
| Year | Tax Paid | Tax Assessment Tax Assessment Total Assessment is a certain percentage of the fair market value that is determined by local assessors to be the total taxable value of land and additions on the property. | Land | Improvement |
|---|---|---|---|---|
| 2025 | $3,195 | $118,740 | -- | -- |
| 2024 | $2,771 | $115,290 | -- | -- |
| 2023 | $2,413 | $111,940 | $0 | $0 |
| 2022 | $2,539 | $108,680 | $0 | $0 |
| 2021 | $2,044 | $105,520 | $0 | $0 |
| 2020 | $2,061 | $105,520 | $0 | $0 |
| 2019 | $1,958 | $102,450 | $0 | $0 |
| 2018 | $1,824 | $96,580 | $0 | $0 |
| 2017 | $1,875 | $93,770 | $0 | $0 |
| 2016 | $1,723 | $91,040 | $0 | $0 |
| 2015 | $1,708 | $88,390 | $0 | $0 |
| 2013 | $1,709 | $83,330 | $0 | $0 |
Source: Public Records
Map
Nearby Homes
- 175 W Baltimore St
- 315 N Gale St
- 300 N Chase St
- 310 N Chase St
- 440 W Riverside St
- 240 N Court St
- 387 E Linden Way
- 220 E Cannon St
- 235 Rock St
- 615 Hager St
- 680 S Alfalfa St
- 61476 Dee Cox Rd
- 64209 Meadow Brook Rd
- Hwy 74
- 3300 Blake Ranch Rd
- 000 Chickadee St
- 54901 Willow St
- 80982 Cougar Ln
- 80269 Park Ln
- 0 Mountain Property Unit 357954927
- 275 W Church St
- 255 W Church St
- 535 N Jones St
- 525 N Jones St
- 570 N Jones St
- 545 N Jones St
- 515 N Jones St
- 235 W Church St
- 555 Jones St
- 580 N Jones St
- 225 W Church St
- 320 W Church St
- 575 N Jones St
- 565 N Jones St
- 280 W Church St
- 290 W Church St
- 260 W Church St
- 240 W Church St
- 280 Water St
- 260 Water St