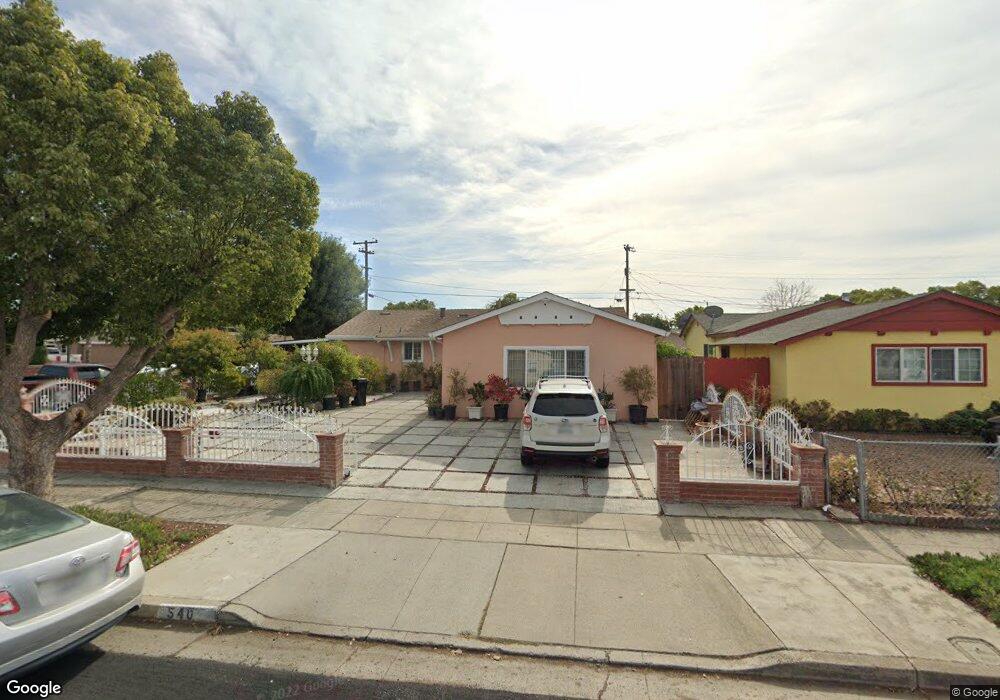
540 Salmon Dr San Jose, CA 95111
Hillsdale NeighborhoodEstimated Value: $1,015,000 - $1,298,723
4
Beds
3
Baths
1,230
Sq Ft
$922/Sq Ft
Est. Value
About This Home
This home is located at 540 Salmon Dr, San Jose, CA 95111 and is currently estimated at $1,134,574, approximately $922 per square foot. 540 Salmon Dr is a home located in Santa Clara County with nearby schools including Franklin Elementary School, Sylvandale Middle School, and Yerba Buena High School.
Ownership History
Date
Name
Owned For
Owner Type
Purchase Details
Closed on
Apr 21, 2021
Sold by
Tran Son Hung and Tran Mariame
Bought by
Tran Son Hung and Tran Mariame
Current Estimated Value
Home Financials for this Owner
Home Financials are based on the most recent Mortgage that was taken out on this home.
Original Mortgage
$430,000
Outstanding Balance
$388,858
Interest Rate
3.1%
Mortgage Type
New Conventional
Estimated Equity
$745,716
Purchase Details
Closed on
Apr 21, 2011
Sold by
Tran Son Hung and Tran Mariame
Bought by
Tran Son Hung and Tran Mariame
Purchase Details
Closed on
Jun 29, 2009
Sold by
Fdic
Bought by
Tran Son Hung and Tran Mariame
Home Financials for this Owner
Home Financials are based on the most recent Mortgage that was taken out on this home.
Original Mortgage
$241,600
Interest Rate
5.31%
Mortgage Type
Purchase Money Mortgage
Purchase Details
Closed on
Feb 20, 2009
Sold by
Tiznado Amalia
Bought by
Indymac Federal Bank Fsb
Purchase Details
Closed on
Jun 9, 2006
Sold by
Cruz Luis Carlos
Bought by
Tiznado Amalia
Home Financials for this Owner
Home Financials are based on the most recent Mortgage that was taken out on this home.
Original Mortgage
$50,000
Interest Rate
14.5%
Mortgage Type
Credit Line Revolving
Purchase Details
Closed on
Aug 20, 2003
Sold by
Cruz Luiz
Bought by
Tiznado Amalia
Home Financials for this Owner
Home Financials are based on the most recent Mortgage that was taken out on this home.
Original Mortgage
$400,000
Interest Rate
6.11%
Mortgage Type
Purchase Money Mortgage
Purchase Details
Closed on
Jun 10, 2003
Sold by
Arenas Jose Luis and Arenas Patricia
Bought by
Cruz Luis and Tiznado Amalia
Home Financials for this Owner
Home Financials are based on the most recent Mortgage that was taken out on this home.
Original Mortgage
$405,000
Interest Rate
7.75%
Mortgage Type
Purchase Money Mortgage
Purchase Details
Closed on
Sep 18, 1997
Sold by
Arenas Jose L and Arenas Isaac
Bought by
Arenas Jose Luis and Arenas Patricia
Home Financials for this Owner
Home Financials are based on the most recent Mortgage that was taken out on this home.
Original Mortgage
$148,000
Interest Rate
7.54%
Purchase Details
Closed on
May 17, 1994
Sold by
Hurdle Maxcine
Bought by
Arenas Jose Luis and Arenas Patricia
Home Financials for this Owner
Home Financials are based on the most recent Mortgage that was taken out on this home.
Original Mortgage
$153,900
Interest Rate
8.3%
Create a Home Valuation Report for This Property
The Home Valuation Report is an in-depth analysis detailing your home's value as well as a comparison with similar homes in the area
Home Values in the Area
Average Home Value in this Area
Purchase History
| Date | Buyer | Sale Price | Title Company |
|---|---|---|---|
| Tran Son Hung | $430,000 | Old Republic Title Company | |
| Tran Son Hung | -- | None Available | |
| Tran Son Hung | $302,000 | Chicago Title Company | |
| Indymac Federal Bank Fsb | $289,807 | None Available | |
| Tiznado Amalia | -- | Financial Title Company | |
| Tiznado Amalia | -- | First American Title Co | |
| Cruz Luis | $450,000 | Alliance Title Company | |
| Arenas Jose Luis | -- | Old Republic Title Company | |
| Arenas Jose Luis | $162,000 | Santa Clara Land Title Co |
Source: Public Records
Mortgage History
| Date | Status | Borrower | Loan Amount |
|---|---|---|---|
| Open | Tran Son Hung | $430,000 | |
| Previous Owner | Tran Son Hung | $241,600 | |
| Previous Owner | Tiznado Amalia | $50,000 | |
| Previous Owner | Tiznado Amalia | $400,000 | |
| Previous Owner | Cruz Luis | $405,000 | |
| Previous Owner | Arenas Jose Luis | $148,000 | |
| Previous Owner | Arenas Jose Luis | $153,900 |
Source: Public Records
Tax History Compared to Growth
Tax History
| Year | Tax Paid | Tax Assessment Tax Assessment Total Assessment is a certain percentage of the fair market value that is determined by local assessors to be the total taxable value of land and additions on the property. | Land | Improvement |
|---|---|---|---|---|
| 2025 | $7,403 | $461,252 | $231,048 | $230,204 |
| 2024 | $7,403 | $452,209 | $226,518 | $225,691 |
| 2023 | $7,294 | $443,343 | $222,077 | $221,266 |
| 2022 | $7,138 | $434,651 | $217,723 | $216,928 |
| 2021 | $6,716 | $398,129 | $213,454 | $184,675 |
| 2020 | $5,973 | $356,438 | $211,266 | $145,172 |
| 2019 | $5,729 | $349,450 | $207,124 | $142,326 |
| 2018 | $5,711 | $342,599 | $203,063 | $139,536 |
| 2017 | $5,634 | $335,882 | $199,082 | $136,800 |
| 2016 | $5,358 | $329,297 | $195,179 | $134,118 |
| 2015 | $5,249 | $324,352 | $192,248 | $132,104 |
| 2014 | $4,791 | $318,000 | $188,483 | $129,517 |
Source: Public Records
Map
Nearby Homes
- 478 Sheridan Place
- 2570 Senter Rd
- 555 Umbarger Rd Unit 131
- 555 Umbarger Rd Unit 43
- 2580 Senter Rd Unit 455
- 2580 Senter Rd Unit 515
- 2664 Senter Rd Unit 109
- 2681 Senter Rd
- 2697 Lone Bluff Way
- 608 Balfour Dr
- 2855 Senter Rd Unit 1
- 2855 Senter Rd Unit 30
- 2855 Senter Rd Unit 84
- 2855 Senter Rd Unit 10
- 2855 Senter Rd Unit 95
- 2855 Senter Rd Unit 72
- 653 Dadis Way
- 677 Dadis Way
- 2795 Garden Ave
- 450 Lewis Rd