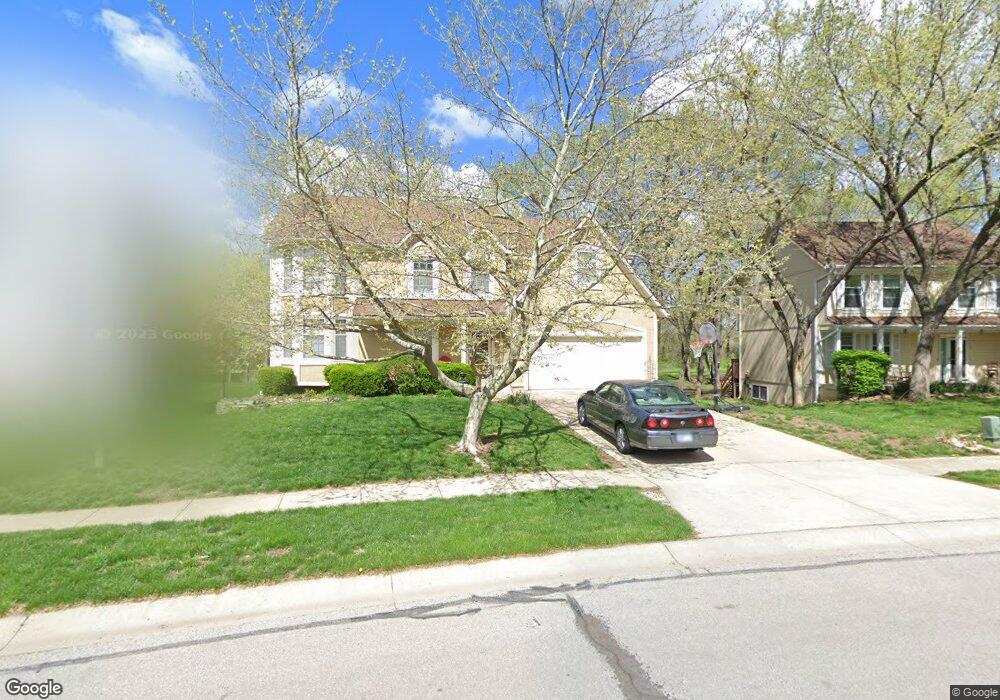
5400 Alden St Shawnee, KS 66216
Estimated Value: $479,000 - $562,000
4
Beds
5
Baths
2,729
Sq Ft
$189/Sq Ft
Est. Value
About This Home
This home is located at 5400 Alden St, Shawnee, KS 66216 and is currently estimated at $514,716, approximately $188 per square foot. 5400 Alden St is a home located in Johnson County with nearby schools including Ray Marsh Elementary School, Trailridge Middle School, and Shawnee Mission Northwest High School.
Ownership History
Date
Name
Owned For
Owner Type
Purchase Details
Closed on
May 23, 2024
Sold by
Berberick George J and Berberick Lisa A
Bought by
George J Berberick And Lisa A Berberick Revoc and Berberick
Current Estimated Value
Purchase Details
Closed on
May 24, 2004
Sold by
Zolotor Dennis P and Zolotor Dolores T
Bought by
Berberick George J and Berberick Lisa A
Home Financials for this Owner
Home Financials are based on the most recent Mortgage that was taken out on this home.
Original Mortgage
$160,000
Interest Rate
5.97%
Mortgage Type
Purchase Money Mortgage
Purchase Details
Closed on
Mar 17, 2001
Sold by
Patwardhan Bhalchandra H and Patwardhan Meenal B
Bought by
Zolotor Dennis P and Zolotor Dolores T
Home Financials for this Owner
Home Financials are based on the most recent Mortgage that was taken out on this home.
Original Mortgage
$161,500
Interest Rate
6.88%
Create a Home Valuation Report for This Property
The Home Valuation Report is an in-depth analysis detailing your home's value as well as a comparison with similar homes in the area
Home Values in the Area
Average Home Value in this Area
Purchase History
| Date | Buyer | Sale Price | Title Company |
|---|---|---|---|
| George J Berberick And Lisa A Berberick Revoc | -- | None Listed On Document | |
| Berberick George J | -- | Chicago Title Insurance Comp | |
| Zolotor Dennis P | -- | Kansas Title |
Source: Public Records
Mortgage History
| Date | Status | Borrower | Loan Amount |
|---|---|---|---|
| Previous Owner | Berberick George J | $160,000 | |
| Previous Owner | Zolotor Dennis P | $161,500 |
Source: Public Records
Tax History Compared to Growth
Tax History
| Year | Tax Paid | Tax Assessment Tax Assessment Total Assessment is a certain percentage of the fair market value that is determined by local assessors to be the total taxable value of land and additions on the property. | Land | Improvement |
|---|---|---|---|---|
| 2024 | $5,096 | $47,967 | $11,030 | $36,937 |
| 2023 | $5,011 | $46,690 | $9,194 | $37,496 |
| 2022 | $4,434 | $41,181 | $9,194 | $31,987 |
| 2021 | $4,303 | $37,571 | $7,996 | $29,575 |
| 2020 | $4,280 | $36,881 | $7,996 | $28,885 |
| 2019 | $4,210 | $36,260 | $6,659 | $29,601 |
| 2018 | $4,117 | $35,317 | $6,659 | $28,658 |
| 2017 | $3,610 | $30,464 | $5,786 | $24,678 |
| 2016 | $3,636 | $30,303 | $5,488 | $24,815 |
| 2015 | $3,342 | $28,854 | $5,488 | $23,366 |
| 2013 | -- | $27,393 | $5,488 | $21,905 |
Source: Public Records
Map
Nearby Homes
- 5502 Mullen Rd
- 5633 Oakview St
- 5713 Widmer Rd
- 13810 W 53rd St
- 5530 Rene St
- 4940 Alden St
- 5826 Oakview St
- 5703 Cottonwood St
- 14210 W 50th St
- 180 Terrace Trail S
- 5300 Summit Ct
- 14105 W 48th Terrace
- 5507 Noland Rd
- 444 Lake Shore Dr
- 5919 Pflumm Rd
- 6143 Park St
- 6145 Park St
- 14214 W 63rd St
- 14204 W 63rd St
- 5021 Bradshaw St