Saratoga Condominiums 5400 Astor Ln Unit 5400201 Rolling Meadows, IL 60008
Busse Woods NeighborhoodEstimated Value: $248,000 - $252,542
2
Beds
--
Bath
1,350
Sq Ft
$185/Sq Ft
Est. Value
About This Home
This home is located at 5400 Astor Ln Unit 5400201, Rolling Meadows, IL 60008 and is currently estimated at $250,136, approximately $185 per square foot. 5400 Astor Ln Unit 5400201 is a home located in Cook County with nearby schools including Willow Bend Elementary School, Carl Sandburg Junior High School, and Rolling Meadows High School.
Ownership History
Date
Name
Owned For
Owner Type
Purchase Details
Closed on
May 9, 2025
Sold by
Usova Anastasia
Bought by
Aguilar Theodore and Aguilar Kaylee
Current Estimated Value
Purchase Details
Closed on
Apr 27, 2007
Sold by
Feldman Michael and Feldman Dina
Bought by
Usova Anastasia
Home Financials for this Owner
Home Financials are based on the most recent Mortgage that was taken out on this home.
Original Mortgage
$21,350
Interest Rate
8.25%
Mortgage Type
Credit Line Revolving
Purchase Details
Closed on
Sep 2, 2005
Sold by
Equities Venture Corp
Bought by
Feldman Michael and Feldman Dina
Home Financials for this Owner
Home Financials are based on the most recent Mortgage that was taken out on this home.
Original Mortgage
$178,415
Interest Rate
7.95%
Mortgage Type
Purchase Money Mortgage
Create a Home Valuation Report for This Property
The Home Valuation Report is an in-depth analysis detailing your home's value as well as a comparison with similar homes in the area
Home Values in the Area
Average Home Value in this Area
Purchase History
| Date | Buyer | Sale Price | Title Company |
|---|---|---|---|
| Aguilar Theodore | $245,000 | Saturn Title | |
| Usova Anastasia | $213,500 | Multiple | |
| Feldman Michael | $210,000 | Chicago Title Insurance Comp |
Source: Public Records
Mortgage History
| Date | Status | Borrower | Loan Amount |
|---|---|---|---|
| Previous Owner | Usova Anastasia | $21,350 | |
| Previous Owner | Usova Anastasia | $170,800 | |
| Previous Owner | Feldman Michael | $178,415 |
Source: Public Records
Tax History Compared to Growth
Tax History
| Year | Tax Paid | Tax Assessment Tax Assessment Total Assessment is a certain percentage of the fair market value that is determined by local assessors to be the total taxable value of land and additions on the property. | Land | Improvement |
|---|---|---|---|---|
| 2024 | $4,413 | $17,765 | $2,083 | $15,682 |
| 2023 | $4,191 | $17,765 | $2,083 | $15,682 |
| 2022 | $4,191 | $17,765 | $2,083 | $15,682 |
| 2021 | $3,410 | $13,683 | $1,366 | $12,317 |
| 2020 | $3,403 | $13,683 | $1,366 | $12,317 |
| 2019 | $3,446 | $15,337 | $1,366 | $13,971 |
| 2018 | $2,167 | $10,157 | $1,171 | $8,986 |
| 2017 | $2,142 | $10,157 | $1,171 | $8,986 |
| 2016 | $2,253 | $10,157 | $1,171 | $8,986 |
| 2015 | $1,793 | $8,347 | $1,041 | $7,306 |
| 2014 | $1,881 | $8,718 | $1,041 | $7,677 |
| 2013 | $2,385 | $10,620 | $1,041 | $9,579 |
Source: Public Records
About Saratoga Condominiums
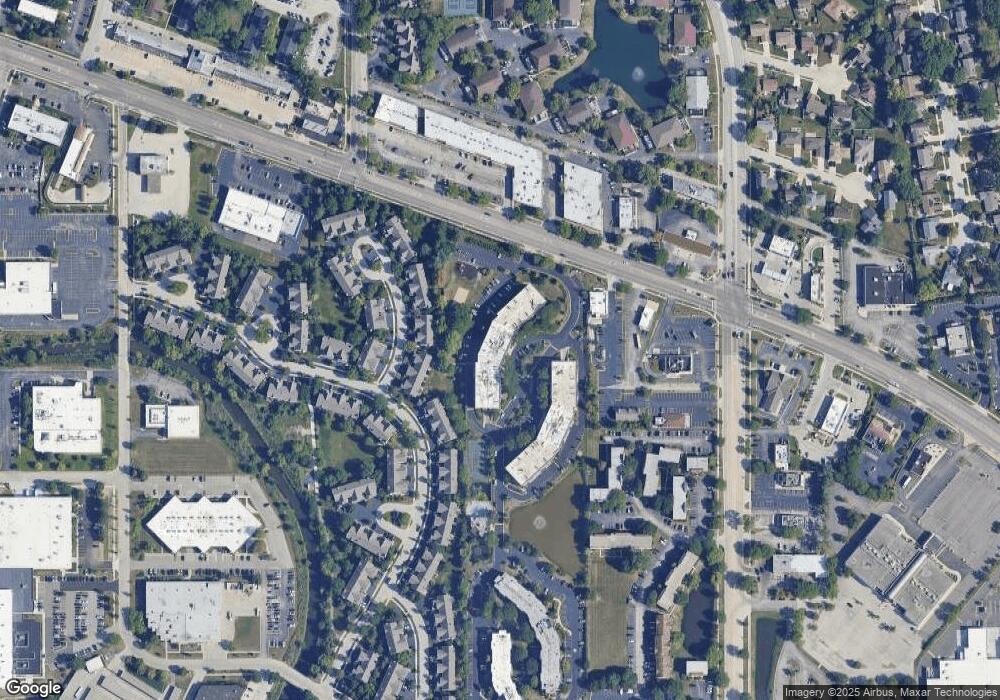
Map
Nearby Homes
- 5400 Astor Ln Unit 306
- 5451 Elizabeth Place Unit 906
- 5406 Chateau Unit 4
- 1860 W Surrey Park Ln Unit 1C
- 1322 S New Wilke Rd Unit 1C
- 5600 Astor Ln Unit 103
- 1510 W Russell Ct
- 1227 S Old Wilke Rd Unit 12209
- 1227 S Old Wilke Rd Unit 306
- 1217 S Old Wilke Rd Unit 11406
- 5500 Carriageway Dr Unit 213
- 5300 Carriageway Dr Unit 302
- 5300 Carriageway Dr Unit 206
- 2402 Algonquin Rd Unit 9
- 1206 S New Wilke Rd Unit 108
- 1207 S Old Wilke Rd Unit 303
- 2312 Algonquin Rd Unit 3
- 5400 Carriageway Dr Unit 109
- 2502 Algonquin Rd Unit 2
- 2504 Algonquin Rd Unit 14
- 5400 Astor Ln Unit 403
- 5400 Astor Ln Unit 404
- 5400 Astor Ln Unit 406
- 5400 Astor Ln Unit 401
- 5400 Astor Ln Unit 312
- 5400 Astor Ln Unit 116
- 5400 Astor Ln Unit 5400318
- 5400 Astor Ln Unit 5400314
- 5400 Astor Ln Unit 5400302
- 5400 Astor Ln Unit 5400202
- 5400 Astor Ln Unit 5400118
- 5400 Astor Ln Unit 5400113
- 5400 Astor Ln Unit 5400106
- 5400 Astor Ln Unit 5400307
- 5400 Astor Ln Unit 5400417
- 5400 Astor Ln Unit 5400211
- 5400 Astor Ln Unit 5400109
- 5400 Astor Ln Unit 5400310
- 5400 Astor Ln Unit 5400215
- 5400 Astor Ln Unit 5400403