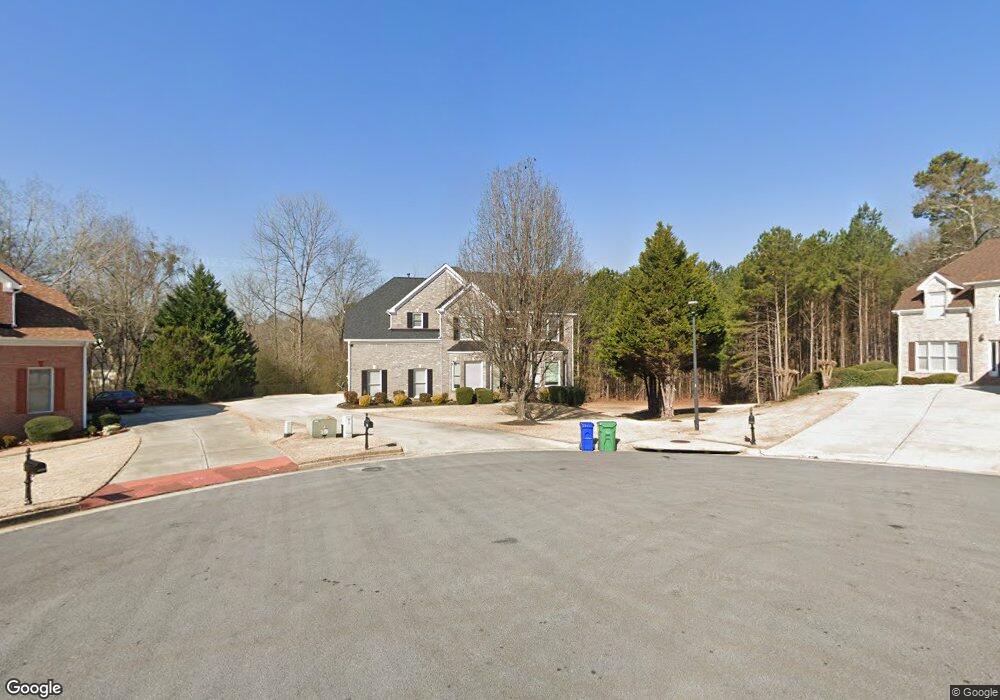
5401 E Saddleridge Ct Lithonia, GA 30038
Estimated Value: $330,536 - $395,000
4
Beds
3
Baths
2,657
Sq Ft
$134/Sq Ft
Est. Value
About This Home
This home is located at 5401 E Saddleridge Ct, Lithonia, GA 30038 and is currently estimated at $356,134, approximately $134 per square foot. 5401 E Saddleridge Ct is a home located in DeKalb County with nearby schools including Flat Rock Elementary School, Salem Middle School, and Martin Luther King- Jr. High School.
Ownership History
Date
Name
Owned For
Owner Type
Purchase Details
Closed on
Jun 19, 2009
Sold by
Jp Morgan Chase Bank
Bought by
Stewart Oneal and Stewart Avril
Current Estimated Value
Home Financials for this Owner
Home Financials are based on the most recent Mortgage that was taken out on this home.
Original Mortgage
$136,800
Outstanding Balance
$86,525
Interest Rate
4.79%
Mortgage Type
New Conventional
Estimated Equity
$269,609
Purchase Details
Closed on
Jan 6, 2009
Sold by
Stephens Derek
Bought by
Jp Morgan Chase Bank
Purchase Details
Closed on
Sep 27, 2002
Sold by
Greenwood Homes Inc
Bought by
Stephens Derek G
Home Financials for this Owner
Home Financials are based on the most recent Mortgage that was taken out on this home.
Original Mortgage
$267,000
Interest Rate
7.5%
Mortgage Type
New Conventional
Create a Home Valuation Report for This Property
The Home Valuation Report is an in-depth analysis detailing your home's value as well as a comparison with similar homes in the area
Home Values in the Area
Average Home Value in this Area
Purchase History
| Date | Buyer | Sale Price | Title Company |
|---|---|---|---|
| Stewart Oneal | $144,000 | -- | |
| Jp Morgan Chase Bank | $245,520 | -- | |
| Stephens Derek G | $267,000 | -- |
Source: Public Records
Mortgage History
| Date | Status | Borrower | Loan Amount |
|---|---|---|---|
| Open | Stewart Oneal | $136,800 | |
| Previous Owner | Stephens Derek G | $267,000 |
Source: Public Records
Tax History
| Year | Tax Paid | Tax Assessment Tax Assessment Total Assessment is a certain percentage of the fair market value that is determined by local assessors to be the total taxable value of land and additions on the property. | Land | Improvement |
|---|---|---|---|---|
| 2025 | $3,857 | $132,880 | $8,000 | $124,880 |
| 2024 | $4,043 | $136,800 | $8,000 | $128,800 |
| 2023 | $4,043 | $130,080 | $8,000 | $122,080 |
Source: Public Records
Map
Nearby Homes
- 5624 Browns Mill Rd
- 4023 Preston Oaks Place
- 5400 Andrew Ln
- 5454 Flat Rock Point
- 4046 Crossvale Rd
- 5236 Sandy Shores Ct
- 5320 Flat Rock Point
- 5221 Sandy Shores Ct
- 4074 Panola Rd
- 5227 Beechwood Forest Dr
- 4230 Sandstone Shores Dr
- 4230 Sandstone Shores Dr Unit 38
- 4215 Sandstone Shores Dr
- 3703 Salem Springs Ct
- 3767 Walnut Creek Way
- 5314 Salem Springs Dr
- 4247 Sawgrass Dr
- 3766 Salem Trail Unit 1
- 3961 Panola Rd
- 3852 Panola Rd
- 5405 E Saddleridge Ct
- 5404 E Saddleridge Ct
- 5411 E Saddleridge Ct
- 5416 E Saddleridge Ct
- 3913 E Saddle Ridge Dr
- 3965 E Saddle Ridge Dr
- 3965 E Saddle Ridge Dr Unit 1
- 5403 E Saddleridge Ln
- 3929 E Saddle Ridge Dr
- 3955 E Saddle Ridge Dr
- 3939 E Saddle Ridge Dr
- 5398 E Saddleridge Ln
- 3905 E Saddle Ridge Dr
- E E Saddleridge Ln
- E E Saddle Ridge Dr Unit 1
- E E Saddle Ridge Dr Unit 34
- E E Saddle Ridge Dr
- 3922 E Saddle Ridge Dr
- 3928 E Saddle Ridge Dr
- 3916 E Saddle Ridge Dr
Your Personal Tour Guide
Ask me questions while you tour the home.