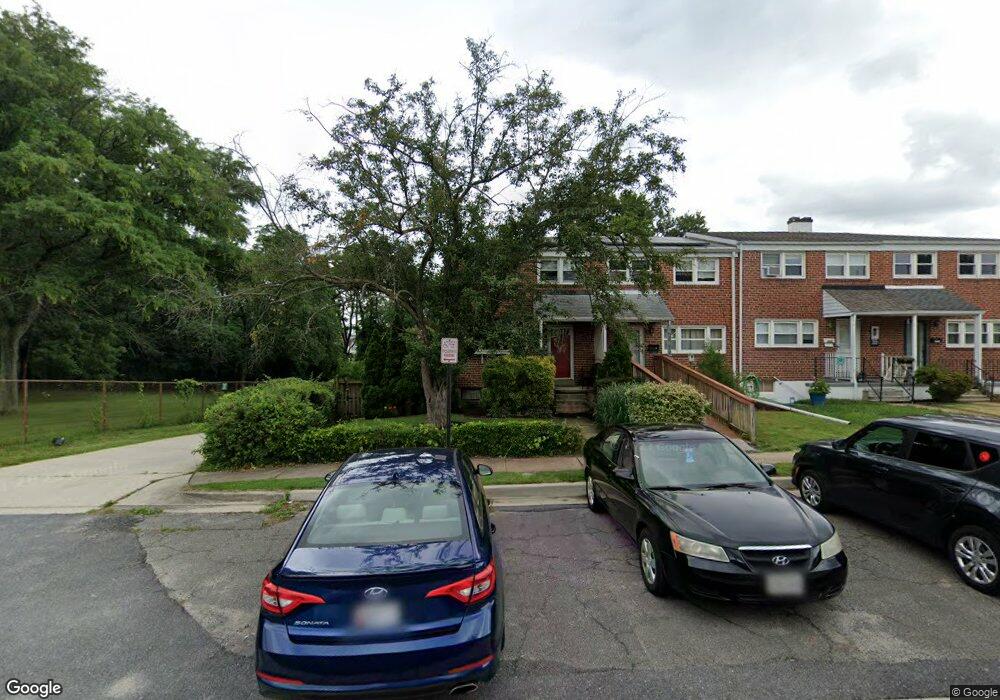
5401 Highridge St Halethorpe, MD 21227
Estimated Value: $286,000 - $303,000
--
Bed
2
Baths
1,152
Sq Ft
$257/Sq Ft
Est. Value
About This Home
This home is located at 5401 Highridge St, Halethorpe, MD 21227 and is currently estimated at $295,645, approximately $256 per square foot. 5401 Highridge St is a home located in Baltimore County with nearby schools including Arbutus Elementary School, Arbutus Middle School, and Lansdowne High School.
Ownership History
Date
Name
Owned For
Owner Type
Purchase Details
Closed on
Jun 28, 2023
Sold by
Happy Properties Llc
Bought by
New Freedom Inc
Current Estimated Value
Purchase Details
Closed on
Feb 15, 2006
Sold by
Buckingham James W
Bought by
Thompson James E
Home Financials for this Owner
Home Financials are based on the most recent Mortgage that was taken out on this home.
Original Mortgage
$45,500
Interest Rate
6.23%
Mortgage Type
Stand Alone Second
Purchase Details
Closed on
Feb 6, 2006
Sold by
Buckingham James W
Bought by
Thompson James E
Home Financials for this Owner
Home Financials are based on the most recent Mortgage that was taken out on this home.
Original Mortgage
$45,500
Interest Rate
6.23%
Mortgage Type
Stand Alone Second
Purchase Details
Closed on
Mar 15, 1999
Sold by
Holden Carmello
Bought by
Buckingham James W
Purchase Details
Closed on
May 25, 1977
Sold by
Shook Melvin J
Bought by
Holden Carmello
Create a Home Valuation Report for This Property
The Home Valuation Report is an in-depth analysis detailing your home's value as well as a comparison with similar homes in the area
Home Values in the Area
Average Home Value in this Area
Purchase History
| Date | Buyer | Sale Price | Title Company |
|---|---|---|---|
| New Freedom Inc | $659,200 | None Listed On Document | |
| Thompson James E | $227,500 | -- | |
| Thompson James E | $227,500 | -- | |
| Buckingham James W | $85,000 | -- | |
| Holden Carmello | $35,000 | -- |
Source: Public Records
Mortgage History
| Date | Status | Borrower | Loan Amount |
|---|---|---|---|
| Previous Owner | Thompson James E | $45,500 | |
| Previous Owner | Thompson James E | $182,000 | |
| Previous Owner | Thompson James E | $182,000 |
Source: Public Records
Tax History Compared to Growth
Tax History
| Year | Tax Paid | Tax Assessment Tax Assessment Total Assessment is a certain percentage of the fair market value that is determined by local assessors to be the total taxable value of land and additions on the property. | Land | Improvement |
|---|---|---|---|---|
| 2025 | $3,962 | $249,300 | -- | -- |
| 2024 | $3,962 | $234,400 | $70,000 | $164,400 |
| 2023 | $1,919 | $227,000 | $0 | $0 |
| 2022 | $3,476 | $219,600 | $0 | $0 |
| 2021 | $3,226 | $212,200 | $52,400 | $159,800 |
| 2020 | $3,226 | $207,600 | $0 | $0 |
| 2019 | $3,199 | $203,000 | $0 | $0 |
| 2018 | $3,122 | $198,400 | $52,400 | $146,000 |
| 2017 | $2,979 | $189,433 | $0 | $0 |
| 2016 | $2,350 | $180,467 | $0 | $0 |
| 2015 | $2,350 | $171,500 | $0 | $0 |
| 2014 | $2,350 | $171,500 | $0 | $0 |
Source: Public Records
Map
Nearby Homes
- 5523 Council St
- 5502 Osage Ave
- 1263 Birch Ave
- 5522 Ashbourne Rd
- 1209 Locust Ave
- 5536 Gayland Rd
- 1200 Oakland Terrace Rd
- 1242 Vogt Ave
- 1312 Poplar Ave
- 5530 Willys Ave
- 1243 Linden Ave
- 1328 Maple Ave
- 1246 Elm Rd
- 1326 Stevens Ave
- 1328 Stevens Ave
- 1309 Linden Ave
- 5613 Chelwynd Rd
- 5632 Braxfield Rd
- 1416 Sulphur Spring Rd
- 1014 Stormont Cir
- 5403 Highridge St
- 5405 Highridge St
- 5407 Highridge St
- 5409 Highridge St
- 5400 Council St
- 5402 Council St
- 5411 Highridge St
- 5406 Council St
- 5413 Highridge St
- 5415 Highridge St
- 5408 Council St
- 5410 Council St
- 5412 Council St
- 5417 Highridge St
- 5400 Highridge St
- 5402 Highridge St
- 5414 Council St
- 5406 Highridge St
- 5408 Highridge St
- 5416 Council St