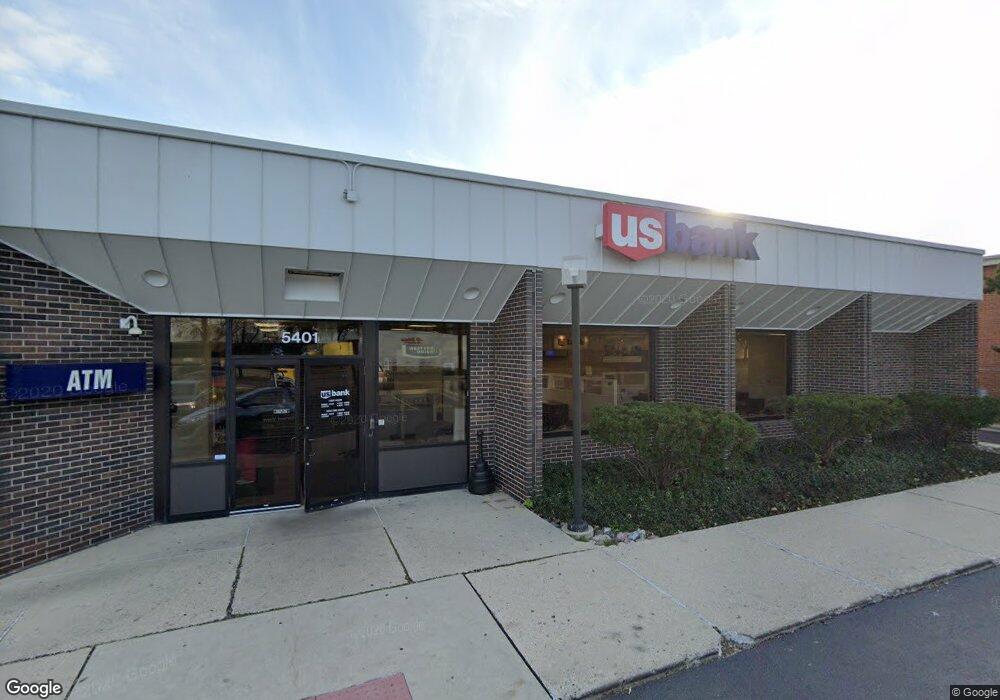
5401 Saint Charles Rd Berkeley, IL 60163
Studio
--
Bath
--
Sq Ft
16,117
Sq Ft Lot
About This Home
This home is located at 5401 Saint Charles Rd, Berkeley, IL 60163. 5401 Saint Charles Rd is a home located in Cook County with nearby schools including Macarthur Intermediate School, Sunnyside Elementary School, and Proviso West High School.
Ownership History
Date
Name
Owned For
Owner Type
Purchase Details
Closed on
Feb 23, 2021
Sold by
Rose Re Llc
Bought by
First Financial Credit Union
Purchase Details
Closed on
Aug 5, 2020
Sold by
Lb Ubs 2007 C1 Il 2 Properties Llc
Bought by
Rose Re Llc
Home Financials for this Owner
Home Financials are based on the most recent Mortgage that was taken out on this home.
Original Mortgage
$85,000
Interest Rate
3%
Mortgage Type
Commercial
Purchase Details
Closed on
Dec 19, 2018
Sold by
Cre Jv Mixed Fifteen Il 1 Branch Holding
Bought by
Lb Ubs 2007 C1 Il 2 Properties Llc
Purchase Details
Closed on
Jul 21, 2006
Sold by
Cre Jv Mixed Fifteen Branch Holdings Llc
Bought by
Cre Jv Mixed Fifteen Il 2 Branch Holding
Purchase Details
Closed on
Jul 6, 2006
Sold by
Charter One Bank Na
Bought by
Cre Jv Mixed Fifteen Branch Holdings Llc
Create a Home Valuation Report for This Property
The Home Valuation Report is an in-depth analysis detailing your home's value as well as a comparison with similar homes in the area
Home Values in the Area
Average Home Value in this Area
Purchase History
| Date | Buyer | Sale Price | Title Company |
|---|---|---|---|
| First Financial Credit Union | $225,000 | Old Republic Title | |
| Rose Re Llc | $110,500 | Fidelity National Title | |
| Lb Ubs 2007 C1 Il 2 Properties Llc | -- | Attorney | |
| Cre Jv Mixed Fifteen Il 2 Branch Holding | -- | First American Title Ins Co | |
| Cre Jv Mixed Fifteen Branch Holdings Llc | $691,500 | First American Title Ins Co |
Source: Public Records
Mortgage History
| Date | Status | Borrower | Loan Amount |
|---|---|---|---|
| Previous Owner | Rose Re Llc | $85,000 |
Source: Public Records
Tax History
| Year | Tax Paid | Tax Assessment Tax Assessment Total Assessment is a certain percentage of the fair market value that is determined by local assessors to be the total taxable value of land and additions on the property. | Land | Improvement |
|---|---|---|---|---|
| 2025 | $19,058 | $51,436 | $50,906 | $530 |
| 2024 | $19,058 | $51,436 | $50,906 | $530 |
| 2023 | $17,847 | $51,436 | $50,906 | $530 |
| 2022 | $17,847 | $40,625 | $40,563 | $62 |
| 2021 | $17,791 | $40,623 | $40,562 | $61 |
| 2020 | $25,704 | $62,239 | $40,562 | $21,677 |
| 2019 | $35,025 | $82,637 | $29,407 | $53,230 |
| 2018 | $34,338 | $82,637 | $29,407 | $53,230 |
| 2017 | $32,824 | $82,637 | $29,407 | $53,230 |
| 2016 | $33,289 | $82,238 | $27,379 | $54,859 |
| 2015 | $33,192 | $82,238 | $27,379 | $54,859 |
| 2014 | $32,590 | $82,238 | $27,379 | $54,859 |
| 2013 | $31,282 | $85,436 | $27,379 | $58,057 |
Source: Public Records
Map
Nearby Homes
- 1529 N Hillside Ave
- 4904 W Hawthorne Ave
- 1463 Speechley Blvd
- 4938 W Randolph St
- 5700 Saint Charles Rd
- 768 N Rohde Ave
- 5706 Saint Charles Rd
- 1447 N Ashbel Ave
- 1428 1/2 N Ashbel Ave
- 51 50th Ave
- 605 N Wolf Rd Unit B9
- 129 49th Ave
- 33 49th Ave
- 520 N Wolf Rd Unit 203
- 5905 Superior St
- 241 48th Ave
- 47 48th Ave
- 512 50th Ave
- 504 N Irving Ave
- 4530 Butterfield Rd
- 5409 St Charles Rd
- 1414 N Wolf Rd
- 1418 N Wolf Rd Unit 6
- 1424 N Wolf Rd
- 1428 N Wolf Rd
- 5425 Saint Charles Rd
- 1432 N Wolf Rd
- 5345 Saint Charles Rd
- 5429 Saint Charles Rd
- 1417 N Wolf Rd
- 1417 N Wolf Rd
- 1421 N Wolf Rd
- 1425 N Wolf Rd
- 1436 N Wolf Rd
- 5337 Saint Charles Rd
- 5414 Bohlander Ave
- 1440 N Wolf Rd
- 1433 N Wolf Rd
- 1414 N Lee Blvd
- 5416 Bohlander Ave
Your Personal Tour Guide
Ask me questions while you tour the home.