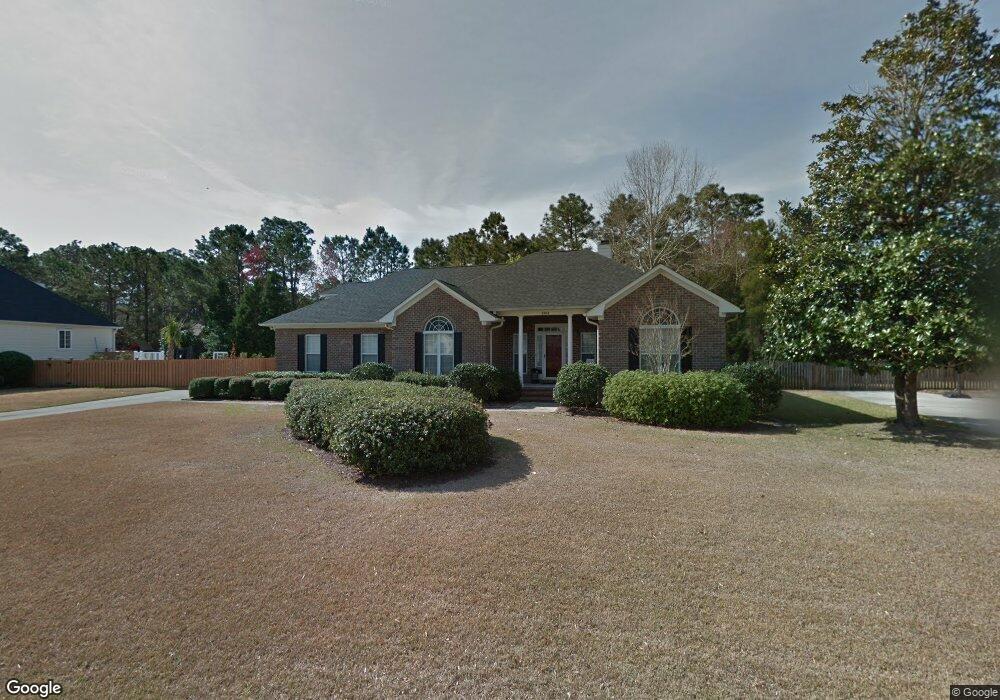
5404 Dunmore Rd Wilmington, NC 28409
Masonboro NeighborhoodEstimated Value: $554,835 - $648,000
3
Beds
2
Baths
2,234
Sq Ft
$273/Sq Ft
Est. Value
About This Home
This home is located at 5404 Dunmore Rd, Wilmington, NC 28409 and is currently estimated at $609,959, approximately $273 per square foot. 5404 Dunmore Rd is a home located in New Hanover County with nearby schools including Masonboro Elementary School, Roland-Grise Middle School, and John T. Hoggard High School.
Ownership History
Date
Name
Owned For
Owner Type
Purchase Details
Closed on
Apr 3, 2007
Sold by
Pecoraro Marilyn B
Bought by
Olson Norman A and Olson Phyllis L
Current Estimated Value
Purchase Details
Closed on
Jul 16, 2004
Sold by
Pecoraro Marc Joseph
Bought by
Pecoraro Marilyn B
Purchase Details
Closed on
May 8, 2000
Sold by
Allen Steven M Janet W
Bought by
Davis Raymond L Jr Kimberly F
Purchase Details
Closed on
Apr 11, 1997
Sold by
Rivenbark Robert H Jr Teela B
Bought by
Allen Steven M Janet W
Purchase Details
Closed on
Apr 25, 1996
Sold by
Halcyon Dev Of Wilm Llc
Bought by
Rivenbark Robert H Jr Teela B
Purchase Details
Closed on
Jun 30, 1995
Sold by
Ballard Frank I Dorothy H
Bought by
Halcyon Dev Of Wilm Llc
Purchase Details
Closed on
May 25, 1995
Sold by
Parsley Jr R A
Bought by
Halcyon Development/Wilm Llc
Create a Home Valuation Report for This Property
The Home Valuation Report is an in-depth analysis detailing your home's value as well as a comparison with similar homes in the area
Home Values in the Area
Average Home Value in this Area
Purchase History
| Date | Buyer | Sale Price | Title Company |
|---|---|---|---|
| Olson Norman A | $337,000 | None Available | |
| Pecoraro Marilyn B | -- | -- | |
| Pecoraro Marilyn B | $254,000 | -- | |
| Old Republic Natl Title Ins | $254,000 | -- | |
| Davis Raymond L Jr Kimberly F | $233,000 | -- | |
| Allen Steven M Janet W | $216,500 | -- | |
| Rivenbark Robert H Jr Teela B | $99,000 | -- | |
| Halcyon Dev Of Wilm Llc | $368,000 | -- | |
| Halcyon Development/Wilm Llc | $199,000 | -- |
Source: Public Records
Tax History Compared to Growth
Tax History
| Year | Tax Paid | Tax Assessment Tax Assessment Total Assessment is a certain percentage of the fair market value that is determined by local assessors to be the total taxable value of land and additions on the property. | Land | Improvement |
|---|---|---|---|---|
| 2025 | $3,424 | $581,900 | $147,100 | $434,800 |
| 2023 | $3,290 | $378,200 | $82,400 | $295,800 |
| 2022 | $3,215 | $378,200 | $82,400 | $295,800 |
| 2021 | $3,237 | $378,200 | $82,400 | $295,800 |
| 2020 | $3,398 | $322,600 | $95,000 | $227,600 |
| 2019 | $3,398 | $322,600 | $95,000 | $227,600 |
| 2018 | $3,398 | $322,600 | $95,000 | $227,600 |
| 2017 | $3,398 | $322,600 | $95,000 | $227,600 |
| 2016 | $3,359 | $303,200 | $95,000 | $208,200 |
| 2015 | $3,211 | $303,200 | $95,000 | $208,200 |
| 2014 | $3,074 | $303,200 | $95,000 | $208,200 |
Source: Public Records
Map
Nearby Homes
- 3711 Grantham Ct
- 3403 Kildare Place
- 5101 Avine Ct
- 3720 Mason Port Dr Unit 60
- 5016 Treybrooke Dr
- 4041 Watersail Dr
- 3805 Mason Port Dr
- 3805 Mason Port Dr Unit 95
- 3927 Watersail Dr
- 3927 Watersail Dr Unit 93
- 4045 Watersail Dr Unit 133
- 4045 Watersail Dr
- 3116 Painted Turtle Loop Unit 22
- 3817 Mason Port Dr
- 3817 Mason Port Dr Unit 98
- The Sea Haven Plan at East and Mason - Sound Side Residences
- The Soundside Plan at East and Mason - Sound Side Residences
- The Morningstar Plan at East and Mason - Sound Side Residences
- The Sandpiper Plan at East and Mason - Sound Side Residences
- The Portulaca Plan at East and Mason - Sound Side Residences
- 5406 Dunmore Rd
- 5400 Dunmore Rd
- 3710 Grantham Ct
- 3403 Tullamore Place
- 3714 Grantham Ct
- 5408 Dunmore Rd
- 5322 Dunmore Rd
- 3404 Tullamore Place
- 5405 Dunmore Rd
- 3718 Grantham Ct
- 3401 Tullamore Place
- 5412 Dunmore Rd
- 5407 Dunmore Rd
- 3715 Grantham Ct
- 3400 Tullamore Place
- 3402 Fin Castle Place
- 5318 Dunmore Rd
- 3722 Grantham Ct
- 5319 Dunmore Rd
- 3719 Grantham Ct