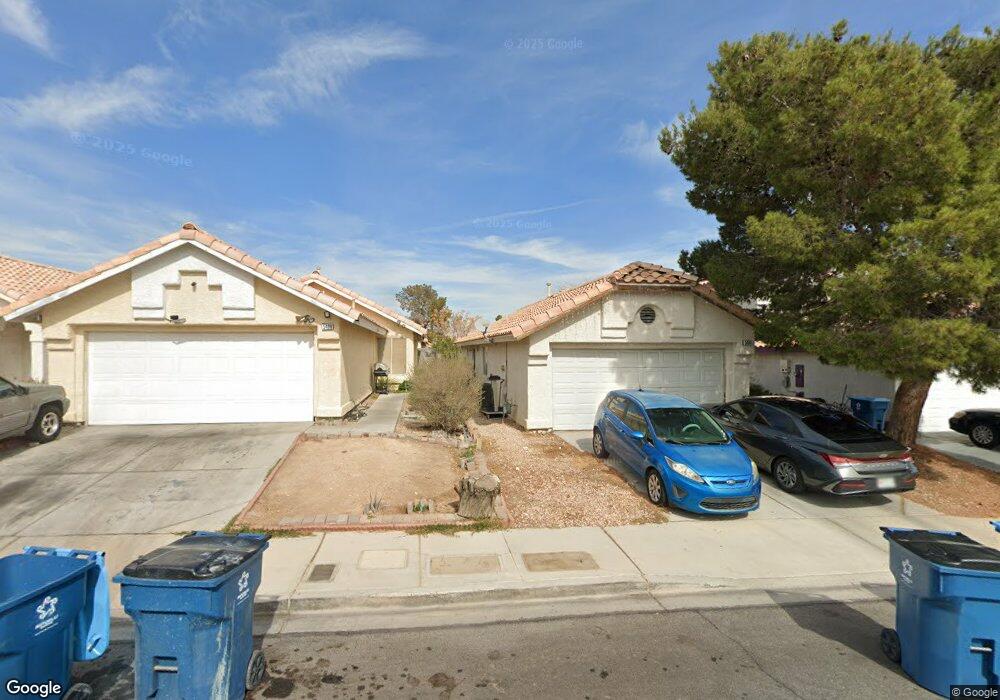
5404 Frank Fenlon Ave Las Vegas, NV 89107
Michael Way NeighborhoodEstimated Value: $352,253 - $369,000
3
Beds
2
Baths
1,168
Sq Ft
$309/Sq Ft
Est. Value
About This Home
This home is located at 5404 Frank Fenlon Ave, Las Vegas, NV 89107 and is currently estimated at $361,063, approximately $309 per square foot. 5404 Frank Fenlon Ave is a home located in Clark County with nearby schools including J.T. McWlliams Elementary School, Robert O Gibson Middle School, and Western High School.
Ownership History
Date
Name
Owned For
Owner Type
Purchase Details
Closed on
Dec 5, 2008
Sold by
Us Bank Association
Bought by
Clark Deanna
Current Estimated Value
Home Financials for this Owner
Home Financials are based on the most recent Mortgage that was taken out on this home.
Original Mortgage
$114,686
Interest Rate
4.92%
Mortgage Type
FHA
Purchase Details
Closed on
Jun 4, 2008
Sold by
Vera Bella Nery
Bought by
Us Bank Na and Credit Suisse First Boston Csfb Armt 200
Purchase Details
Closed on
Dec 29, 2005
Sold by
Mora Lechuga Alvaro
Bought by
Vera Bella Nery
Home Financials for this Owner
Home Financials are based on the most recent Mortgage that was taken out on this home.
Original Mortgage
$50,000
Interest Rate
6.27%
Mortgage Type
New Conventional
Purchase Details
Closed on
Dec 20, 2005
Sold by
Williamson Barry and Williamson Patricia A
Bought by
Vera Belly Nery
Home Financials for this Owner
Home Financials are based on the most recent Mortgage that was taken out on this home.
Original Mortgage
$50,000
Interest Rate
6.27%
Mortgage Type
New Conventional
Purchase Details
Closed on
Aug 23, 2004
Sold by
Burns Alice H
Bought by
Williamson Barry and Williamson Patricia A
Home Financials for this Owner
Home Financials are based on the most recent Mortgage that was taken out on this home.
Original Mortgage
$163,800
Interest Rate
4.87%
Mortgage Type
Unknown
Purchase Details
Closed on
Nov 7, 2000
Sold by
Burns William C and Burns Alice H
Bought by
Burns Alice H
Home Financials for this Owner
Home Financials are based on the most recent Mortgage that was taken out on this home.
Original Mortgage
$102,000
Interest Rate
7.82%
Purchase Details
Closed on
Aug 31, 1997
Sold by
Borgens Dean O and Borgens Madeline M
Bought by
Burns William C and Burns Alice H
Home Financials for this Owner
Home Financials are based on the most recent Mortgage that was taken out on this home.
Original Mortgage
$88,400
Interest Rate
9.5%
Purchase Details
Closed on
Mar 26, 1996
Sold by
Borgens Dean O and Borgens Madeline M
Bought by
Borgens Dean O and Borgens Madeline M
Purchase Details
Closed on
Nov 18, 1995
Sold by
Borgens Dean O and Borgens Madeline M
Bought by
Borgens Dean O and Borgens Madeline M
Purchase Details
Closed on
Dec 3, 1994
Sold by
National Horizon Corp
Bought by
Borgens Dean O and Borgens Madeline M
Home Financials for this Owner
Home Financials are based on the most recent Mortgage that was taken out on this home.
Original Mortgage
$82,923
Interest Rate
9.1%
Mortgage Type
VA
Create a Home Valuation Report for This Property
The Home Valuation Report is an in-depth analysis detailing your home's value as well as a comparison with similar homes in the area
Home Values in the Area
Average Home Value in this Area
Purchase History
| Date | Buyer | Sale Price | Title Company |
|---|---|---|---|
| Clark Deanna | $116,200 | Chicago Title Las Vegas | |
| Us Bank Na | $135,000 | None Available | |
| Vera Bella Nery | -- | Ticor Title Of Nevada Inc | |
| Vera Belly Nery | $250,000 | Ticor Title Of Nevada Inc | |
| Williamson Barry | $182,000 | Lawyers Title Of Nevada | |
| Burns Alice H | -- | Land Title | |
| Burns William C | $104,000 | Land Title | |
| Borgens Dean O | -- | -- | |
| Borgens Dean O | -- | -- | |
| Borgens Dean O | $92,000 | Land Title |
Source: Public Records
Mortgage History
| Date | Status | Borrower | Loan Amount |
|---|---|---|---|
| Previous Owner | Clark Deanna | $114,686 | |
| Previous Owner | Vera Bella Nery | $50,000 | |
| Previous Owner | Vera Belly Nery | $200,000 | |
| Previous Owner | Williamson Barry | $163,800 | |
| Previous Owner | Burns Alice H | $102,000 | |
| Previous Owner | Burns William C | $88,400 | |
| Previous Owner | Borgens Dean O | $82,923 |
Source: Public Records
Tax History Compared to Growth
Tax History
| Year | Tax Paid | Tax Assessment Tax Assessment Total Assessment is a certain percentage of the fair market value that is determined by local assessors to be the total taxable value of land and additions on the property. | Land | Improvement |
|---|---|---|---|---|
| 2025 | $1,570 | $65,807 | $25,550 | $40,257 |
| 2024 | $1,639 | $65,807 | $25,550 | $40,257 |
| 2023 | $1,156 | $66,093 | $26,250 | $39,843 |
| 2022 | $1,258 | $57,405 | $21,000 | $36,405 |
| 2021 | $1,165 | $55,777 | $21,000 | $34,777 |
| 2020 | $1,079 | $54,558 | $19,950 | $34,608 |
| 2019 | $1,011 | $49,599 | $15,400 | $34,199 |
| 2018 | $965 | $44,869 | $11,900 | $32,969 |
| 2017 | $1,462 | $44,611 | $11,200 | $33,411 |
| 2016 | $1,156 | $40,057 | $8,400 | $31,657 |
| 2015 | $1,149 | $30,947 | $5,600 | $25,347 |
| 2014 | $873 | $25,853 | $4,550 | $21,303 |
Source: Public Records
Map
Nearby Homes
- 5420 Moonstruck Ave
- 600 Woodmount Dr
- 5400 Maddox Ave
- 5620 Roseridge Ave
- 5305 Sugarfoot Ave
- 5612 Pearldrop Ave
- 5705 Pearldrop Ave
- 601 Huntington St
- 5713 Whiteridge Ave
- 5709 Goldmount Ave
- 5720 Goldmount Ave
- 304 Orland St Unit 53
- 304 Orland St Unit 56
- 304 Orland St Unit 39
- 304 Orland St Unit 38
- 304 Orland St Unit 47
- 304 Orland St Unit 43
- 212 Orland St Unit 23
- 212 Orland St Unit 28
- 212 Orland St Unit 22
- 5408 Frank Fenlon Ave
- 5400 Frank Fenlon Ave
- 5412 Frank Fenlon Ave
- 5405 Maddox Ave
- 5409 Maddox Ave
- 5416 Frank Fenlon Ave
- 5401 Maddox Ave
- 5413 Maddox Ave
- 5413 Maddox Ave
- 5420 Frank Fenlon Ave
- 5417 Maddox Ave
- 5405 Frank Fenlon Ave
- 5401 Frank Fenlon Ave
- 5409 Frank Fenlon Ave
- 508 Sarajane Ln
- 512 Sarajane Ln
- 504 Sarajane Ln
- 5413 Frank Fenlon Ave
- 516 Sarajane Ln
- 5421 Maddox Ave