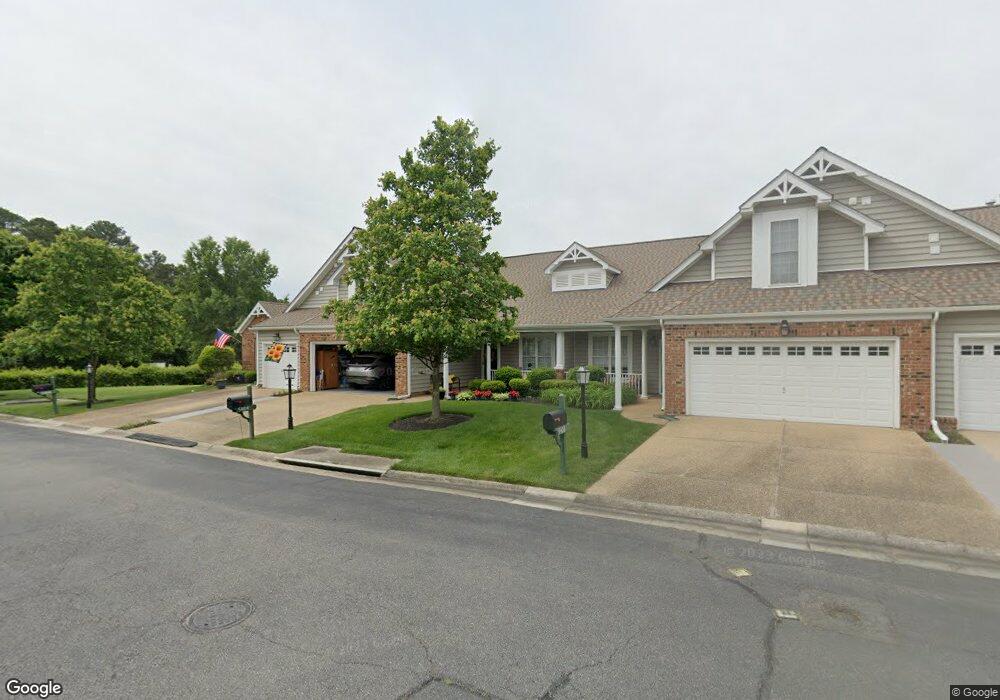
5404 Fuller Dr Unit J3 Glen Allen, VA 23059
Estimated Value: $446,000 - $466,284
3
Beds
2
Baths
1,731
Sq Ft
$261/Sq Ft
Est. Value
About This Home
This home is located at 5404 Fuller Dr Unit J3, Glen Allen, VA 23059 and is currently estimated at $452,071, approximately $261 per square foot. 5404 Fuller Dr Unit J3 is a home located in Henrico County with nearby schools including Shady Grove Elementary School, Short Pump Middle School, and Deep Run High School.
Ownership History
Date
Name
Owned For
Owner Type
Purchase Details
Closed on
Apr 7, 2023
Sold by
Dyer Kathleen G
Bought by
Dyer Kathleen G and Dyer Kelly J
Current Estimated Value
Purchase Details
Closed on
Sep 10, 2021
Sold by
Koshy Kayalakakathu George and Koshy Shannon L
Bought by
Dyer Kathleen G
Home Financials for this Owner
Home Financials are based on the most recent Mortgage that was taken out on this home.
Original Mortgage
$124,900
Interest Rate
2.8%
Mortgage Type
New Conventional
Purchase Details
Closed on
Jun 12, 2014
Sold by
Thorpe Don W
Bought by
Koshy Kayalakakathu G
Home Financials for this Owner
Home Financials are based on the most recent Mortgage that was taken out on this home.
Original Mortgage
$143,750
Interest Rate
4.19%
Mortgage Type
New Conventional
Purchase Details
Closed on
Dec 20, 2010
Sold by
Phillips Shawn L
Bought by
Thorpe Don W
Home Financials for this Owner
Home Financials are based on the most recent Mortgage that was taken out on this home.
Original Mortgage
$218,400
Interest Rate
4.17%
Mortgage Type
New Conventional
Create a Home Valuation Report for This Property
The Home Valuation Report is an in-depth analysis detailing your home's value as well as a comparison with similar homes in the area
Home Values in the Area
Average Home Value in this Area
Purchase History
| Date | Buyer | Sale Price | Title Company |
|---|---|---|---|
| Dyer Kathleen G | -- | None Listed On Document | |
| Dyer Kathleen G | -- | None Listed On Document | |
| Dyer Kathleen G | $364,900 | Attorney | |
| Koshy Kayalakakathu G | $287,500 | -- | |
| Thorpe Don W | $273,000 | -- |
Source: Public Records
Mortgage History
| Date | Status | Borrower | Loan Amount |
|---|---|---|---|
| Previous Owner | Dyer Kathleen G | $124,900 | |
| Previous Owner | Koshy Kayalakakathu G | $143,750 | |
| Previous Owner | Thorpe Don W | $218,400 |
Source: Public Records
Tax History Compared to Growth
Tax History
| Year | Tax Paid | Tax Assessment Tax Assessment Total Assessment is a certain percentage of the fair market value that is determined by local assessors to be the total taxable value of land and additions on the property. | Land | Improvement |
|---|---|---|---|---|
| 2025 | $3,771 | $426,400 | $74,000 | $352,400 |
| 2024 | $3,771 | $426,400 | $74,000 | $352,400 |
| 2023 | $3,624 | $426,400 | $74,000 | $352,400 |
| 2022 | $2,893 | $340,400 | $74,000 | $266,400 |
| 2021 | $2,841 | $327,100 | $70,000 | $257,100 |
| 2020 | $2,846 | $327,100 | $70,000 | $257,100 |
| 2019 | $2,487 | $285,900 | $70,000 | $215,900 |
| 2018 | $2,455 | $282,200 | $70,000 | $212,200 |
| 2017 | $2,455 | $282,200 | $70,000 | $212,200 |
| 2016 | $2,420 | $278,200 | $66,000 | $212,200 |
| 2015 | $2,281 | $278,200 | $66,000 | $212,200 |
| 2014 | $2,281 | $262,200 | $58,000 | $204,200 |
Source: Public Records
Map
Nearby Homes
- 6573 Glenshaw Dr
- 5604 Ashton Park Ct
- 5525 Barnsley Terrace
- 5824 Ketterley Row
- 12024 Stonewick Place
- 12012 Layton Dr
- 12009 Club Commons Dr
- 10605 Gate House Ct
- 11900 Westcott Ridge Terrace
- 5835 Shady Hills Way
- 5156 Farmount Terrace
- 5707 Stoneacre Ct
- 6225 Kershaw Dr
- 6233 Kershaw Dr
- 12309 Hardwick Ct
- 11012 Ellis Meadows Ln
- 6209 Winsted Ct
- 12516 Collinstone Ct
- 0 Manakin Rd Unit VAGO2000320
- 12109 Oxford Landing Dr Unit 104
- 5404 Fuller Dr
- 5404 Fuller Dr
- 5404 Fuller Dr Unit 5404
- 5408 Fuller Dr Unit J2
- 5400 Fuller Dr Unit J4
- 5412 Fuller Dr
- 5412 Fuller Dr Unit 5412
- 5412 Fuller Dr Unit J1
- 5430 Fuller Dr
- 5430 Fuller Dr
- 5430 Fuller Dr Unit 5430
- 6601 Pinepoint Dr
- 6601 Pinepoint Dr Unit K 1
- 5518 Ashton Park Way
- 5518 Ashton Park Way
- 5434 Fuller Dr
- 5434 Fuller Dr Unit 5434
- 5431 Fuller Dr Unit 1
- 5431 Fuller Dr
- 6605 Pinepoint Dr