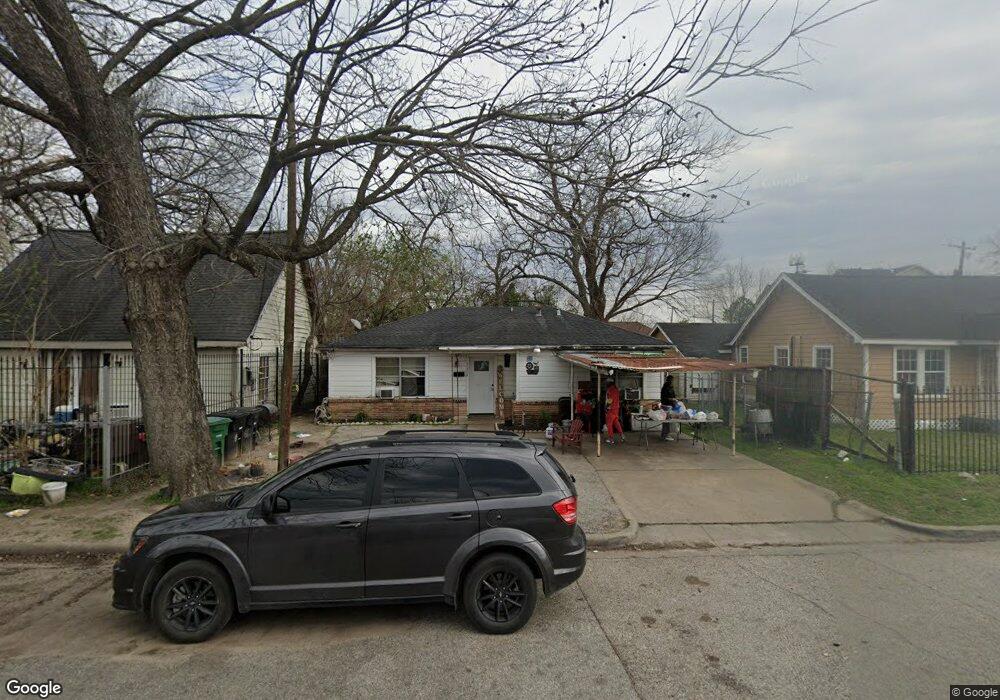
5404 Terry St Houston, TX 77009
Ryon NeighborhoodEstimated Value: $227,799 - $267,000
3
Beds
1
Bath
1,032
Sq Ft
$239/Sq Ft
Est. Value
About This Home
This home is located at 5404 Terry St, Houston, TX 77009 and is currently estimated at $246,450, approximately $238 per square foot. 5404 Terry St is a home located in Harris County with nearby schools including Jefferson Elementary School, Marshall Middle, and Northside High School.
Ownership History
Date
Name
Owned For
Owner Type
Purchase Details
Closed on
Jul 11, 2018
Sold by
Hawkins Paul James and Bodunier Vanessa P
Bought by
Page Aretha L
Current Estimated Value
Purchase Details
Closed on
Aug 27, 1998
Sold by
Levine Bernard E and Levine Shirley T
Bought by
Khan Asim S
Home Financials for this Owner
Home Financials are based on the most recent Mortgage that was taken out on this home.
Original Mortgage
$41,745
Interest Rate
6.94%
Purchase Details
Closed on
Aug 14, 1998
Sold by
Kimball Hill Homes Of Texas Inc
Bought by
Benitez Jaime and Benitez Josefina
Home Financials for this Owner
Home Financials are based on the most recent Mortgage that was taken out on this home.
Original Mortgage
$41,745
Interest Rate
6.94%
Create a Home Valuation Report for This Property
The Home Valuation Report is an in-depth analysis detailing your home's value as well as a comparison with similar homes in the area
Home Values in the Area
Average Home Value in this Area
Purchase History
| Date | Buyer | Sale Price | Title Company |
|---|---|---|---|
| Page Aretha L | -- | None Available | |
| Khan Asim S | -- | Fidelity National Title | |
| Benitez Jaime | -- | Premier Title Company |
Source: Public Records
Mortgage History
| Date | Status | Borrower | Loan Amount |
|---|---|---|---|
| Previous Owner | Khan Asim S | $41,745 | |
| Previous Owner | Benitez Jaime | $92,100 |
Source: Public Records
Tax History Compared to Growth
Tax History
| Year | Tax Paid | Tax Assessment Tax Assessment Total Assessment is a certain percentage of the fair market value that is determined by local assessors to be the total taxable value of land and additions on the property. | Land | Improvement |
|---|---|---|---|---|
| 2025 | $4,321 | $208,701 | $150,000 | $58,701 |
| 2024 | $4,321 | $206,500 | $150,000 | $56,500 |
| 2023 | $4,321 | $191,477 | $125,000 | $66,477 |
| 2022 | $4,175 | $189,610 | $125,000 | $64,610 |
| 2021 | $3,307 | $141,874 | $85,000 | $56,874 |
| 2020 | $3,516 | $145,212 | $85,000 | $60,212 |
| 2019 | $3,675 | $145,212 | $85,000 | $60,212 |
| 2018 | $2,946 | $116,406 | $60,000 | $56,406 |
| 2017 | $2,048 | $105,969 | $50,000 | $55,969 |
| 2016 | $1,862 | $97,598 | $45,000 | $52,598 |
| 2015 | $55 | $82,380 | $27,500 | $54,880 |
| 2014 | $55 | $60,867 | $22,500 | $38,367 |
Source: Public Records
Map
Nearby Homes