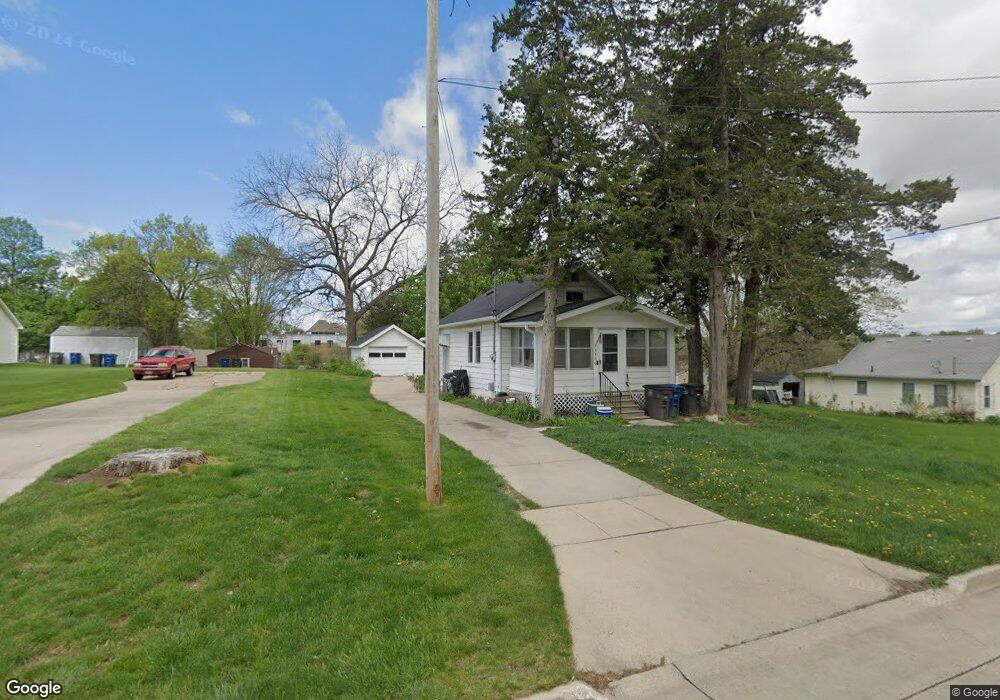
5406 SW 8th St Des Moines, IA 50315
South Central DSM NeighborhoodEstimated Value: $105,752 - $142,000
1
Bed
1
Bath
480
Sq Ft
$263/Sq Ft
Est. Value
About This Home
This home is located at 5406 SW 8th St, Des Moines, IA 50315 and is currently estimated at $126,438, approximately $263 per square foot. 5406 SW 8th St is a home located in Polk County with nearby schools including South Union Elementary School, Brody Middle School, and Lincoln High School.
Ownership History
Date
Name
Owned For
Owner Type
Purchase Details
Closed on
Nov 23, 2007
Sold by
Vasey Henry and Vasey Becky
Bought by
Osgood Steven E and Osgood Dody A
Current Estimated Value
Home Financials for this Owner
Home Financials are based on the most recent Mortgage that was taken out on this home.
Original Mortgage
$64,000
Outstanding Balance
$40,681
Interest Rate
6.47%
Mortgage Type
Purchase Money Mortgage
Estimated Equity
$85,757
Purchase Details
Closed on
Jul 28, 1999
Sold by
Jackovich I Victor L and Jackovich Mary K
Bought by
Heer Terrill L
Create a Home Valuation Report for This Property
The Home Valuation Report is an in-depth analysis detailing your home's value as well as a comparison with similar homes in the area
Home Values in the Area
Average Home Value in this Area
Purchase History
| Date | Buyer | Sale Price | Title Company |
|---|---|---|---|
| Osgood Steven E | $63,500 | None Available | |
| Heer Terrill L | $24,500 | -- |
Source: Public Records
Mortgage History
| Date | Status | Borrower | Loan Amount |
|---|---|---|---|
| Open | Osgood Steven E | $64,000 |
Source: Public Records
Tax History Compared to Growth
Tax History
| Year | Tax Paid | Tax Assessment Tax Assessment Total Assessment is a certain percentage of the fair market value that is determined by local assessors to be the total taxable value of land and additions on the property. | Land | Improvement |
|---|---|---|---|---|
| 2025 | $1,678 | $96,800 | $32,100 | $64,700 |
| 2024 | $1,678 | $85,300 | $28,100 | $57,200 |
| 2023 | $1,596 | $85,300 | $28,100 | $57,200 |
| 2022 | $1,584 | $67,700 | $23,100 | $44,600 |
| 2021 | $1,480 | $67,700 | $23,100 | $44,600 |
| 2020 | $1,538 | $59,300 | $20,300 | $39,000 |
| 2019 | $1,416 | $59,300 | $20,300 | $39,000 |
| 2018 | $1,402 | $52,700 | $17,800 | $34,900 |
| 2017 | $1,300 | $52,700 | $17,800 | $34,900 |
| 2016 | $1,268 | $48,100 | $16,200 | $31,900 |
| 2015 | $1,268 | $48,100 | $16,200 | $31,900 |
| 2014 | $1,214 | $47,400 | $16,100 | $31,300 |
Source: Public Records
Map
Nearby Homes
- 5407 SW 9th St
- 5402 SW 8th St
- 520 Hackley Ave
- 1004 Titus Ave
- 1207 Kenyon Ave
- 1010 Frederick Ave
- 303 Porter Ave
- 936 Mckinley Ave Unit 14
- 5812 SW 5th St
- 299 Hackley Ave
- 1210 Highview Dr
- 1243 Hackley Ave
- 5814 SW 3rd St
- . Herold Ave
- 212 Titus Ave
- 1229 Evans St
- 1304 Wall Ave
- 5501 S Union St
- 4916 SW 13th St
- 1116 Herold Ave