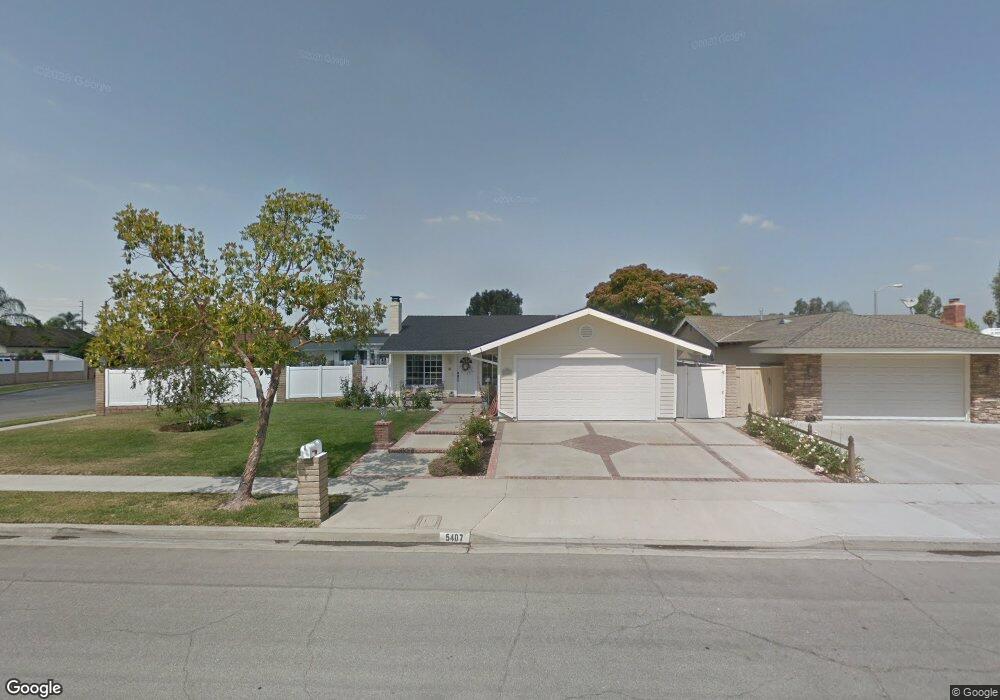
5407 Rutland Dr Yorba Linda, CA 92886
Estimated Value: $1,161,765 - $1,198,000
4
Beds
2
Baths
1,737
Sq Ft
$681/Sq Ft
Est. Value
About This Home
This home is located at 5407 Rutland Dr, Yorba Linda, CA 92886 and is currently estimated at $1,182,441, approximately $680 per square foot. 5407 Rutland Dr is a home located in Orange County with nearby schools including Van Buren Elementary School, Kraemer Middle School, and Valencia High School.
Ownership History
Date
Name
Owned For
Owner Type
Purchase Details
Closed on
Jan 23, 2025
Sold by
Joseph Sharin K and Bergman Family Trust
Bought by
Bergman Family Trust and Joseph
Current Estimated Value
Purchase Details
Closed on
Jun 14, 2001
Sold by
Kemmer David R and Kemmer Elizabeth A
Bought by
Bergman David A and Bergman Sharin K
Home Financials for this Owner
Home Financials are based on the most recent Mortgage that was taken out on this home.
Original Mortgage
$125,000
Interest Rate
7.62%
Purchase Details
Closed on
Dec 30, 1996
Sold by
Joyce Robert E and Joyce Diane A
Bought by
Kemmer David R and Kemmer Elizabeth A
Home Financials for this Owner
Home Financials are based on the most recent Mortgage that was taken out on this home.
Original Mortgage
$169,600
Interest Rate
7.58%
Create a Home Valuation Report for This Property
The Home Valuation Report is an in-depth analysis detailing your home's value as well as a comparison with similar homes in the area
Home Values in the Area
Average Home Value in this Area
Purchase History
| Date | Buyer | Sale Price | Title Company |
|---|---|---|---|
| Bergman Family Trust | -- | None Listed On Document | |
| Bergman Family Trust | -- | None Listed On Document | |
| Bergman David A | $330,000 | Commonwealth Land Title | |
| Kemmer David R | $212,000 | Gateway Title |
Source: Public Records
Mortgage History
| Date | Status | Borrower | Loan Amount |
|---|---|---|---|
| Previous Owner | Bergman David A | $125,000 | |
| Previous Owner | Kemmer David R | $169,600 |
Source: Public Records
Tax History Compared to Growth
Tax History
| Year | Tax Paid | Tax Assessment Tax Assessment Total Assessment is a certain percentage of the fair market value that is determined by local assessors to be the total taxable value of land and additions on the property. | Land | Improvement |
|---|---|---|---|---|
| 2025 | $5,851 | $502,034 | $382,776 | $119,258 |
| 2024 | $5,851 | $492,191 | $375,271 | $116,920 |
| 2023 | $5,742 | $482,541 | $367,913 | $114,628 |
| 2022 | $5,680 | $473,080 | $360,699 | $112,381 |
| 2021 | $5,577 | $463,804 | $353,626 | $110,178 |
| 2020 | $5,471 | $459,049 | $350,000 | $109,049 |
| 2019 | $5,287 | $450,049 | $343,138 | $106,911 |
| 2018 | $5,221 | $441,225 | $336,410 | $104,815 |
| 2017 | $5,137 | $432,574 | $329,814 | $102,760 |
| 2016 | $5,035 | $424,093 | $323,347 | $100,746 |
| 2015 | $4,974 | $417,723 | $318,490 | $99,233 |
| 2014 | $4,829 | $409,541 | $312,251 | $97,290 |
Source: Public Records
Map
Nearby Homes
- 732 Olivier Dr
- 726 Olivier Dr
- 727 Olivier Dr
- 718 Olivier Dr
- 714 Olivier Dr
- 707 Olivier Dr
- 653 Patten Ave
- 1261 Desoto St
- 625 Patten Ave
- 582 Mcfadden St
- Elina Plan at Vista Rose
- Lyda Plan at Vista Rose
- Prairie Plan at Vista Rose
- Gallica Plan at Vista Rose
- 1551 E Ray Dr
- 17001 La Kenice Way
- 1524 Larsen Ln
- 1527 Evans Ln
- 1270 E Providence Loop
- 1259 E Providence Loop
- 5403 Rutland Dr
- 16927 Suffolk Cir
- 5435 Rutland Dr
- 16926 Norfolk Cir
- 16922 Suffolk Cir
- 5412 Rutland Dr
- 5402 Rutland Dr
- 5422 Rutland Dr
- 16926 Suffolk Cir
- 5382 Rutland Dr
- 16922 Norfolk Cir
- 5432 Rutland Dr
- 5445 Rutland Dr
- 5361 Rutland Dr
- 5372 Rutland Dr
- 16927 Norfolk Cir
- 5442 Rutland Dr
- 16901 Durham Dr
- 5412 Westmoreland Dr
- 5402 Westmoreland Dr