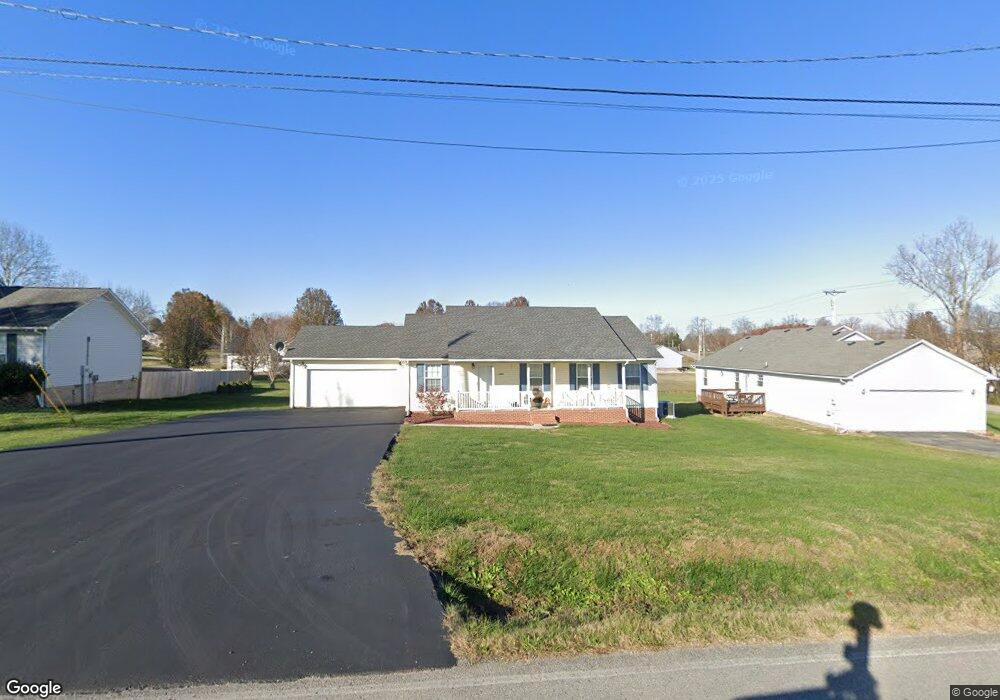
5408 Mirandy Rd Cookeville, TN 38506
Estimated Value: $261,409 - $309,000
--
Bed
2
Baths
1,408
Sq Ft
$208/Sq Ft
Est. Value
About This Home
This home is located at 5408 Mirandy Rd, Cookeville, TN 38506 and is currently estimated at $293,102, approximately $208 per square foot. 5408 Mirandy Rd is a home located in Putnam County with nearby schools including Algood Middle School, Algood Elementary School, and Cookeville High School.
Ownership History
Date
Name
Owned For
Owner Type
Purchase Details
Closed on
Jul 1, 2008
Sold by
Fox Cathy D
Bought by
Killham Richard E
Current Estimated Value
Home Financials for this Owner
Home Financials are based on the most recent Mortgage that was taken out on this home.
Original Mortgage
$104,130
Outstanding Balance
$67,041
Interest Rate
6.03%
Estimated Equity
$226,061
Purchase Details
Closed on
Jun 3, 2005
Sold by
Buchanan Paul H
Bought by
Fox Cathy D
Home Financials for this Owner
Home Financials are based on the most recent Mortgage that was taken out on this home.
Original Mortgage
$102,000
Interest Rate
5.66%
Purchase Details
Closed on
Apr 12, 2005
Sold by
Langford Hollie E
Bought by
Buchanan Paul H
Home Financials for this Owner
Home Financials are based on the most recent Mortgage that was taken out on this home.
Original Mortgage
$102,000
Interest Rate
5.66%
Purchase Details
Closed on
Apr 24, 2002
Sold by
Dennis Chaffin and Dennis Debra
Bought by
Langford Hollie E
Purchase Details
Closed on
Aug 13, 2001
Sold by
Gene Allred
Bought by
Dennis Chaffin
Create a Home Valuation Report for This Property
The Home Valuation Report is an in-depth analysis detailing your home's value as well as a comparison with similar homes in the area
Home Values in the Area
Average Home Value in this Area
Purchase History
| Date | Buyer | Sale Price | Title Company |
|---|---|---|---|
| Killham Richard E | $117,000 | -- | |
| Fox Cathy D | $102,000 | -- | |
| Buchanan Paul H | $90,000 | -- | |
| Langford Hollie E | $86,000 | -- | |
| Dennis Chaffin | $8,500 | -- |
Source: Public Records
Mortgage History
| Date | Status | Borrower | Loan Amount |
|---|---|---|---|
| Open | Dennis Chaffin | $104,130 | |
| Closed | Dennis Chaffin | $20,000 | |
| Previous Owner | Dennis Chaffin | $102,000 |
Source: Public Records
Tax History Compared to Growth
Tax History
| Year | Tax Paid | Tax Assessment Tax Assessment Total Assessment is a certain percentage of the fair market value that is determined by local assessors to be the total taxable value of land and additions on the property. | Land | Improvement |
|---|---|---|---|---|
| 2024 | $1,104 | $41,500 | $5,000 | $36,500 |
| 2023 | $1,104 | $41,500 | $5,000 | $36,500 |
| 2022 | $1,026 | $41,500 | $5,000 | $36,500 |
| 2021 | $1,026 | $41,500 | $5,000 | $36,500 |
| 2020 | $885 | $41,500 | $5,000 | $36,500 |
| 2019 | $885 | $30,250 | $3,375 | $26,875 |
| 2018 | $826 | $30,250 | $3,375 | $26,875 |
| 2017 | $826 | $30,250 | $3,375 | $26,875 |
| 2016 | $826 | $30,250 | $3,375 | $26,875 |
| 2015 | $849 | $30,250 | $3,375 | $26,875 |
| 2014 | $812 | $28,951 | $0 | $0 |
Source: Public Records
Map
Nearby Homes
- 1916 Bear Creek Point
- 3435 Northwind Dr
- 2035 Bear Creek Point
- 3429 Wj Robinson Rd
- 1663 Paran Rd
- 3011 Zeb Warren Rd
- 4201 Mirandy Rd
- 0 Bear Creek Cir
- 3006 Deerhaven Dr N
- 3485 Officers Chapel Rd
- 000 Mirandy Rd
- 2908 Deerhaven Dr S
- 3930 Olyvia Ct
- 30 AC W Paron Rd
- 902 Evelyn Ct
- 1081 Cynthia St
- 5004 Curtis Way
- 5898 Hilham Rd
- 6538 6538 Hilham Rd
- 6538 Hilham Rd
- 2871 Paran Rd
- 2860 Paran Pointe Dr
- 2854 Paran Pointe Dr
- 5372 Mirandy Rd
- 2848 Paran Pointe Dr
- 2859 Paran Pointe Dr
- 2839 Paran Rd
- 2859 Paran Pointe Dr
- 2760 Paran Rd
- 2853 Paran Pointe Dr
- 2930 Paran Rd
- 2816 Paran Pointe Dr
- 2842 Paran Pointe Dr
- 2810 Paran Pointe Dr
- 2770 Paran Rd
- 2847 Paran Pointe Dr
- 2804 Paran Pointe Dr
- 2780 Paran Rd
- 2841 Paran Pointe Dr
- 2790 Paran Rd