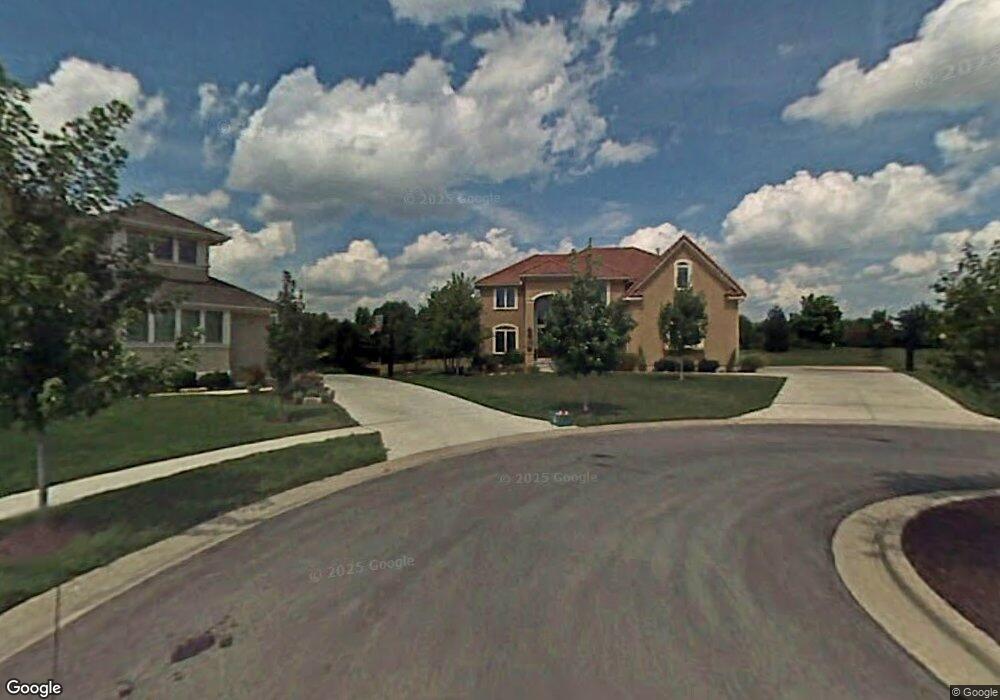
5408 W 148th Terrace Overland Park, KS 66224
Estimated Value: $836,000 - $876,000
5
Beds
5
Baths
3,458
Sq Ft
$249/Sq Ft
Est. Value
About This Home
This home is located at 5408 W 148th Terrace, Overland Park, KS 66224 and is currently estimated at $860,540, approximately $248 per square foot. 5408 W 148th Terrace is a home located in Johnson County with nearby schools including Sunrise Point Elementary School, Prairie Star Middle School, and Blue Valley High School.
Ownership History
Date
Name
Owned For
Owner Type
Purchase Details
Closed on
Jan 10, 2011
Sold by
Roy Howard R and Roy Lori M
Bought by
Roy Howard R and Roy Lori M
Current Estimated Value
Purchase Details
Closed on
Oct 20, 2003
Sold by
Gianni Homes Inc
Bought by
Roy Randy R and Roy Lori M
Home Financials for this Owner
Home Financials are based on the most recent Mortgage that was taken out on this home.
Original Mortgage
$400,000
Interest Rate
5.99%
Mortgage Type
Construction
Purchase Details
Closed on
Sep 29, 2003
Sold by
White Horse Development Llc
Bought by
Gianni Homes Inc
Home Financials for this Owner
Home Financials are based on the most recent Mortgage that was taken out on this home.
Original Mortgage
$400,000
Interest Rate
5.99%
Mortgage Type
Construction
Create a Home Valuation Report for This Property
The Home Valuation Report is an in-depth analysis detailing your home's value as well as a comparison with similar homes in the area
Home Values in the Area
Average Home Value in this Area
Purchase History
| Date | Buyer | Sale Price | Title Company |
|---|---|---|---|
| Roy Howard R | -- | None Available | |
| Roy Randy R | -- | Security Land Title Company | |
| Gianni Homes Inc | -- | Security Land Title Company |
Source: Public Records
Mortgage History
| Date | Status | Borrower | Loan Amount |
|---|---|---|---|
| Previous Owner | Roy Randy R | $400,000 |
Source: Public Records
Tax History Compared to Growth
Tax History
| Year | Tax Paid | Tax Assessment Tax Assessment Total Assessment is a certain percentage of the fair market value that is determined by local assessors to be the total taxable value of land and additions on the property. | Land | Improvement |
|---|---|---|---|---|
| 2024 | $10,033 | $89,746 | $19,517 | $70,229 |
| 2023 | $9,398 | $83,134 | $19,517 | $63,617 |
| 2022 | $9,337 | $80,822 | $19,517 | $61,305 |
| 2021 | $8,903 | $73,692 | $17,747 | $55,945 |
| 2020 | $8,624 | $69,955 | $17,747 | $52,208 |
| 2019 | $8,404 | $66,712 | $16,129 | $50,583 |
| 2018 | $8,039 | $62,917 | $14,657 | $48,260 |
| 2017 | $8,178 | $62,928 | $14,657 | $48,271 |
| 2016 | $7,665 | $59,064 | $13,997 | $45,067 |
| 2015 | $7,640 | $58,156 | $13,997 | $44,159 |
| 2013 | -- | $55,257 | $11,571 | $43,686 |
Source: Public Records
Map
Nearby Homes
- 5304 W 148th St
- 14713 Ash St
- 5701 W 148th Place
- 14724 Maple St
- 14913 Ash St
- 5108 W 150th St
- 5264 W 150th Terrace
- 14712 Maple St
- 14738 Outlook St
- 5817 W 147th Place
- 5501 W 146th St
- 14708 Cedar St
- 5701 W 146th St
- 14606 Briar St
- 5437 W 145th Terrace
- 15107 Reeds St
- 14605 Dearborn St
- 14810 Sherwood St
- 14814 Sherwood St
- 14606 Granada Rd
- 5413 W 148th Terrace
- 5404 W 148th Terrace
- 5305 W 148th St
- 5400 W 148th Terrace
- 5409 W 148th Terrace
- 14808 Birch St
- 5301 W 148th St
- 5405 W 148th Terrace
- 5503 W 148th Terrace
- 5502 W 148th Terrace
- 14820 Birch St
- 14815 Birch St
- 14813 Birch St
- 14819 Birch St
- 14805 Birch St
- 14809 Birch St
- 14811 Birch St
- 5205 W 148th St
- 5507 W 148th Terrace
- 5300 W 148th St