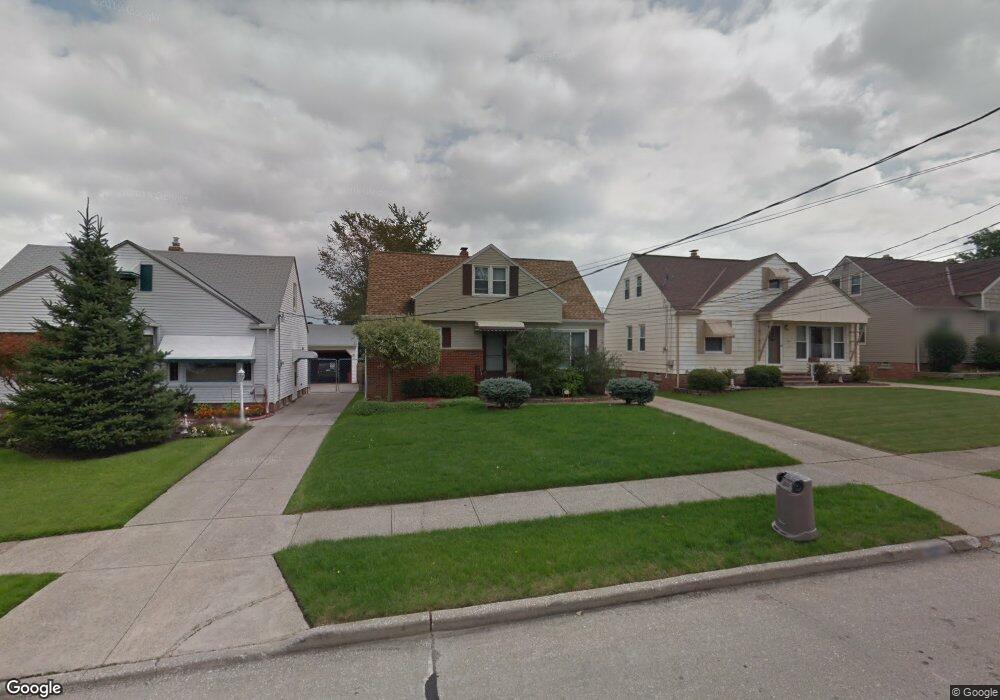
5409 E 132nd St Cleveland, OH 44125
Estimated Value: $142,189 - $167,000
About This Home
This home is located at 5409 E 132nd St, Cleveland, OH 44125 and is currently estimated at $154,047, approximately $116 per square foot. 5409 E 132nd St is a home located in Cuyahoga County with nearby schools including Garfield Heights High School, North Shore High School, and St Benedict Catholic School.
Ownership History
We collect this data history from publicly available records. To have your information removed, we recommend requesting removal directly through your county’s website.
Purchase Details
Home Financials for this Owner
Home Financials are based on the most recent Mortgage that was taken out on this home.Purchase Details
Purchase Details
Purchase Details
Purchase Details
Purchase Details
Home Values in the Area
Average Home Value in this Area
Purchase History
We collect this data history from publicly available records. To have your information removed, we recommend requesting removal directly through your county’s website.
| Date | Buyer | Sale Price | Title Company |
|---|---|---|---|
| $104,100 | Executive Title | ||
| -- | -- | ||
| $85,900 | -- | ||
| $80,000 | -- | ||
| -- | -- | ||
| -- | -- |
Mortgage History
We collect this data history from publicly available records. To have your information removed, we recommend requesting removal directly through your county’s website.
| Date | Status | Borrower | Loan Amount |
|---|---|---|---|
| Open | $100,977 |
Tax History
We collect this data history from publicly available records. To have your information removed, we recommend requesting removal directly through your county’s website.
| Year | Tax Paid | Tax Assessment Tax Assessment Total Assessment is a certain percentage of the fair market value that is determined by local assessors to be the total taxable value of land and additions on the property. | Land | Improvement |
|---|---|---|---|---|
| 2025 | $3,568 | $43,610 | $8,680 | $34,930 |
| 2024 | $4,439 | $43,610 | $8,680 | $34,930 |
| 2023 | $3,504 | $31,750 | $6,230 | $25,520 |
| 2022 | $3,455 | $31,750 | $6,230 | $25,520 |
| 2021 | $3,652 | $31,750 | $6,230 | $25,520 |
| 2020 | $3,133 | $25,380 | $4,970 | $20,410 |
| 2019 | $3,105 | $72,500 | $14,200 | $58,300 |
| 2018 | $3,234 | $25,380 | $4,970 | $20,410 |
| 2017 | $3,101 | $23,740 | $4,170 | $19,570 |
| 2016 | $3,146 | $23,740 | $4,170 | $19,570 |
| 2015 | $3,024 | $23,740 | $4,170 | $19,570 |
| 2014 | $3,024 | $25,000 | $4,380 | $20,620 |
Map
- 13009 Darlington Ave
- 13629 Granger Rd
- 13402 Shady Oak Blvd
- 13917 Wolf Ave
- 13706 Shady Oak Blvd
- 12329 Darlington Ave
- 12328 Granger Rd
- 12304 Tonsing Dr
- 12605 Shady Oak Blvd
- 13708 Woodward Blvd
- 13500 Oakview Blvd
- 13008 Oakview Blvd
- 13508 Oakview Blvd
- 5197 Milo Ave
- 13701 Maple Leaf Dr
- 14510 Granger Rd
- 14522 Granger Rd
- 13504 Maple Leaf Dr
- 14512 Granger Rd
- 12809 Mccracken Rd Unit 1
- 5413 E 132nd St
- 5405 E 132nd St
- 5417 E 132nd St
- 5401 E 132nd St
- 5404 E 134th St
- 5408 E 134th St
- 5421 E 132nd St
- 5400 E 134th St
- 5397 E 132nd St
- 5412 E 134th St
- 5396 E 134th St
- 5408 E 132nd St
- 5412 E 132nd St
- 5404 E 132nd St
- 5393 E 132nd St
- 5416 E 134th St
- 5392 E 134th St
- 5416 E 132nd St
- 5400 E 132nd St
- 13209 Bangor Ave
Ask me questions while you tour the home.