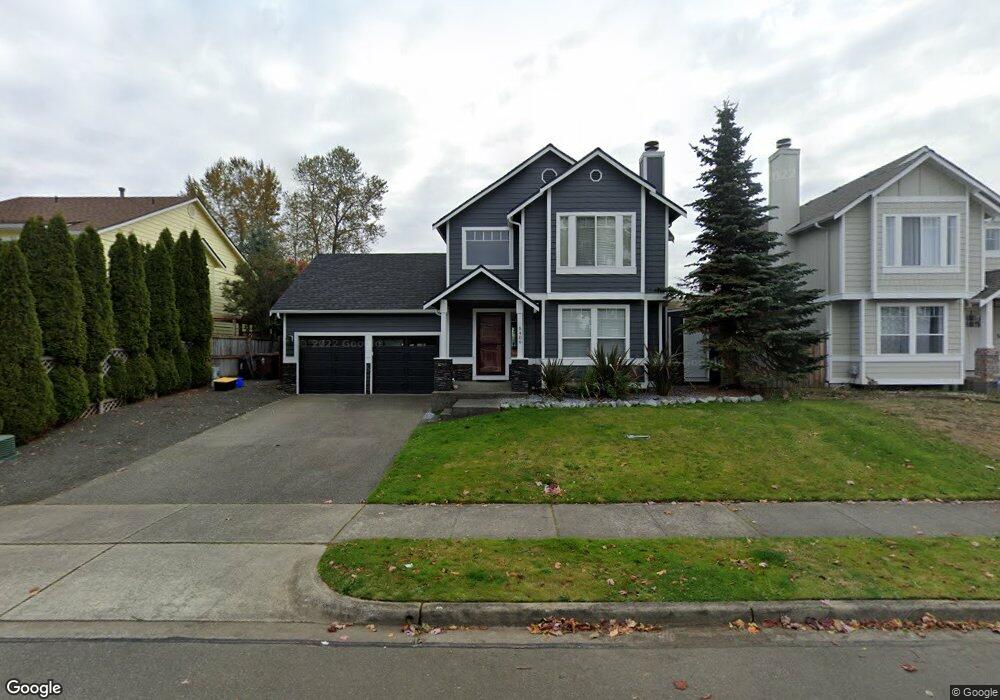
5409 E E St Tacoma, WA 98404
Eastside NeighborhoodEstimated Value: $466,000 - $498,000
3
Beds
3
Baths
1,640
Sq Ft
$293/Sq Ft
Est. Value
About This Home
This home is located at 5409 E E St, Tacoma, WA 98404 and is currently estimated at $480,248, approximately $292 per square foot. 5409 E E St is a home located in Pierce County with nearby schools including Oakland High School, Hunt Middle School, and Lincoln High School.
Ownership History
Date
Name
Owned For
Owner Type
Purchase Details
Closed on
Sep 21, 2007
Sold by
Glenn John F
Bought by
Glenn Debra A and Glenn John F
Current Estimated Value
Home Financials for this Owner
Home Financials are based on the most recent Mortgage that was taken out on this home.
Original Mortgage
$208,000
Outstanding Balance
$131,961
Interest Rate
6.61%
Mortgage Type
New Conventional
Estimated Equity
$348,287
Purchase Details
Closed on
Aug 20, 1999
Sold by
Luu Tuong L
Bought by
Glenn John F
Home Financials for this Owner
Home Financials are based on the most recent Mortgage that was taken out on this home.
Original Mortgage
$121,600
Interest Rate
5.3%
Create a Home Valuation Report for This Property
The Home Valuation Report is an in-depth analysis detailing your home's value as well as a comparison with similar homes in the area
Home Values in the Area
Average Home Value in this Area
Purchase History
| Date | Buyer | Sale Price | Title Company |
|---|---|---|---|
| Glenn Debra A | -- | First American Title Ins Co | |
| Glenn John F | $148,915 | Rainier Title Company |
Source: Public Records
Mortgage History
| Date | Status | Borrower | Loan Amount |
|---|---|---|---|
| Open | Glenn Debra A | $208,000 | |
| Closed | Glenn John F | $121,600 |
Source: Public Records
Tax History
| Year | Tax Paid | Tax Assessment Tax Assessment Total Assessment is a certain percentage of the fair market value that is determined by local assessors to be the total taxable value of land and additions on the property. | Land | Improvement |
|---|---|---|---|---|
| 2025 | $4,580 | $459,000 | $183,300 | $275,700 |
| 2024 | $4,580 | $435,700 | $173,100 | $262,600 |
| 2023 | $4,580 | $411,300 | $164,600 | $246,700 |
| 2022 | $4,732 | $482,700 | $187,600 | $295,100 |
| 2021 | $4,240 | $337,300 | $111,600 | $225,700 |
| 2019 | $3,622 | $307,100 | $93,300 | $213,800 |
| 2018 | $3,904 | $278,600 | $75,000 | $203,600 |
| 2017 | $3,477 | $247,100 | $62,200 | $184,900 |
| 2016 | $2,939 | $183,600 | $46,000 | $137,600 |
| 2014 | $2,589 | $169,000 | $45,400 | $123,600 |
| 2013 | $2,589 | $155,400 | $39,800 | $115,600 |
Source: Public Records
Map
Nearby Homes
Your Personal Tour Guide
Ask me questions while you tour the home.