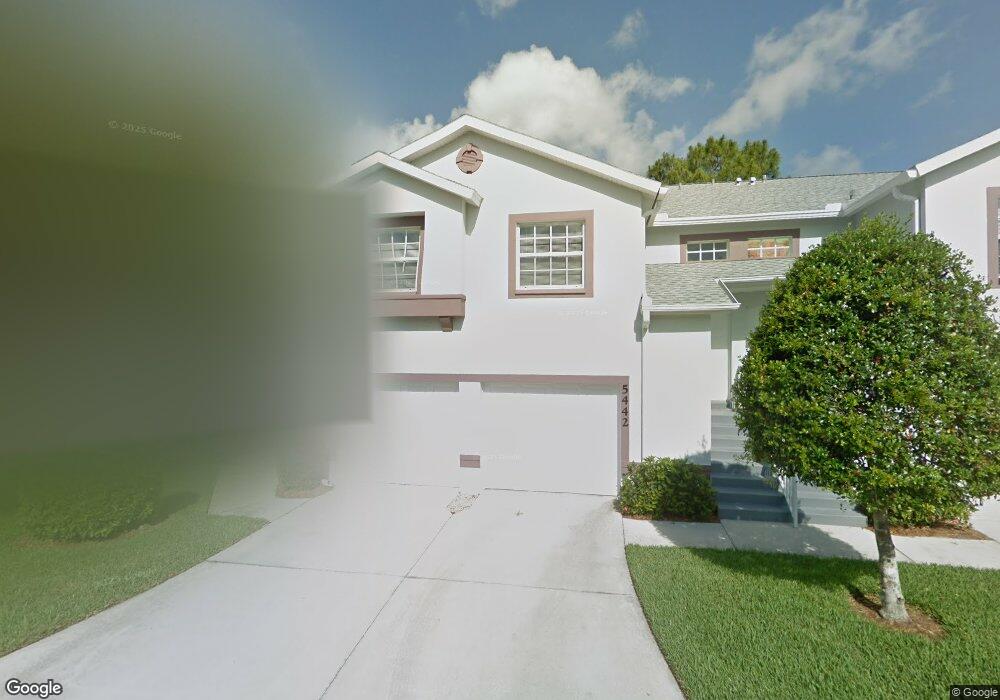
5409 Fair Oaks St Unit 9B Bradenton, FL 34203
Braden River NeighborhoodEstimated Value: $225,000 - $243,000
3
Beds
2
Baths
1,208
Sq Ft
$193/Sq Ft
Est. Value
About This Home
This home is located at 5409 Fair Oaks St Unit 9B, Bradenton, FL 34203 and is currently estimated at $232,923, approximately $192 per square foot. 5409 Fair Oaks St Unit 9B is a home located in Manatee County with nearby schools including Tara Elementary School, Braden River Middle School, and Braden River High School.
Ownership History
Date
Name
Owned For
Owner Type
Purchase Details
Closed on
Oct 7, 2024
Sold by
Mvi Partners Llc
Bought by
Heimbrock Joseph and Heimbrock Cathy
Current Estimated Value
Purchase Details
Closed on
Nov 30, 2005
Sold by
Howard Franklin P and Howard Pamela S
Bought by
Mvi Partners Llc
Home Financials for this Owner
Home Financials are based on the most recent Mortgage that was taken out on this home.
Original Mortgage
$250,000
Interest Rate
6.23%
Mortgage Type
Fannie Mae Freddie Mac
Purchase Details
Closed on
Dec 22, 1997
Sold by
Rotolo Jay J
Bought by
Howard Franklin P and Howard Pamela S
Purchase Details
Closed on
Jul 30, 1996
Sold by
Tara Manatee Inc
Bought by
Rotolo Jay and Rotolo Cindy
Home Financials for this Owner
Home Financials are based on the most recent Mortgage that was taken out on this home.
Original Mortgage
$81,100
Interest Rate
8.12%
Create a Home Valuation Report for This Property
The Home Valuation Report is an in-depth analysis detailing your home's value as well as a comparison with similar homes in the area
Home Values in the Area
Average Home Value in this Area
Purchase History
| Date | Buyer | Sale Price | Title Company |
|---|---|---|---|
| Heimbrock Joseph | $100 | None Listed On Document | |
| Mvi Partners Llc | $250,000 | -- | |
| Howard Franklin P | $110,000 | -- | |
| Rotolo Jay | $115,900 | -- |
Source: Public Records
Mortgage History
| Date | Status | Borrower | Loan Amount |
|---|---|---|---|
| Previous Owner | Mvi Partners Llc | $250,000 | |
| Previous Owner | Rotolo Jay | $81,100 |
Source: Public Records
Tax History Compared to Growth
Tax History
| Year | Tax Paid | Tax Assessment Tax Assessment Total Assessment is a certain percentage of the fair market value that is determined by local assessors to be the total taxable value of land and additions on the property. | Land | Improvement |
|---|---|---|---|---|
| 2025 | $2,972 | $221,000 | -- | $221,000 |
| 2024 | $2,972 | $246,500 | -- | $246,500 |
| 2023 | $2,965 | $250,750 | $0 | $250,750 |
| 2022 | $2,341 | $169,050 | $0 | $169,050 |
| 2021 | $1,938 | $125,000 | $0 | $125,000 |
| 2020 | $2,003 | $123,000 | $0 | $123,000 |
| 2019 | $1,979 | $120,000 | $0 | $120,000 |
| 2018 | $2,088 | $133,000 | $0 | $0 |
| 2017 | $1,848 | $125,000 | $0 | $0 |
| 2016 | $1,609 | $99,900 | $0 | $0 |
| 2015 | $1,503 | $89,172 | $0 | $0 |
| 2014 | $1,503 | $89,173 | $0 | $0 |
| 2013 | $1,523 | $89,173 | $1 | $89,172 |
Source: Public Records
Map
Nearby Homes
- 6534 Fairway Gardens Dr Unit 17201
- 6315 Green Oak Cir Unit 13-A
- 6503 Stone River Rd Unit 109
- 6330 Green Oak Cir
- 5507 Fair Oaks St Unit 3-C
- 6501 Stone River Rd Unit 304
- 6501 Stone River Rd Unit 209
- 6568 Fairway Gardens Dr Unit 6568
- 6505 Stone River Rd Unit 209
- 6505 Stone River Rd Unit 309
- 6505 Stone River Rd Unit 202
- 6591 Fairway Gardens Dr Unit 2-102
- 6507 Stone River Rd Unit 302
- 6507 Stone River Rd Unit 304
- 6507 Stone River Rd Unit 310
- 6507 Stone River Rd Unit 306
- 6618 Pineview Terrace
- 6620 Pineview Terrace
- 6594 Fairway Gardens Dr Unit 201
- 6629 Pineview Terrace Unit 5-201
- 5413 Fair Oaks St Unit A
- 5413 Fair Oaks St Unit 9A
- 5413 Fair Oaks St Unit 5413
- 5405 Fair Oaks St Unit 9C
- 5401 Fair Oaks St Unit 5401
- 5401 Fair Oaks St Unit 9D
- 5401 Fair Oaks St Unit .
- 5417 Fair Oaks St
- 5417 Fair Oaks St Unit 8D
- 5417 Fair Oaks St Unit 5417
- 5421 Fair Oaks St
- 5421 Fair Oaks St Unit 8-c
- 5425 Fair Oaks St
- 5429 Fair Oaks St Unit 8A
- 6510 Fairway Gardens Dr Unit 102
- 6512 Fairway Gardens Dr Unit 202
- 6503 Fairway Gardens Dr Unit 6503
- 6503 Fairway Gardens Dr Unit 20-201
- 6503 Fairway Gardens Dr Unit 201
- 6501 Fairway Gardens Dr Unit 101