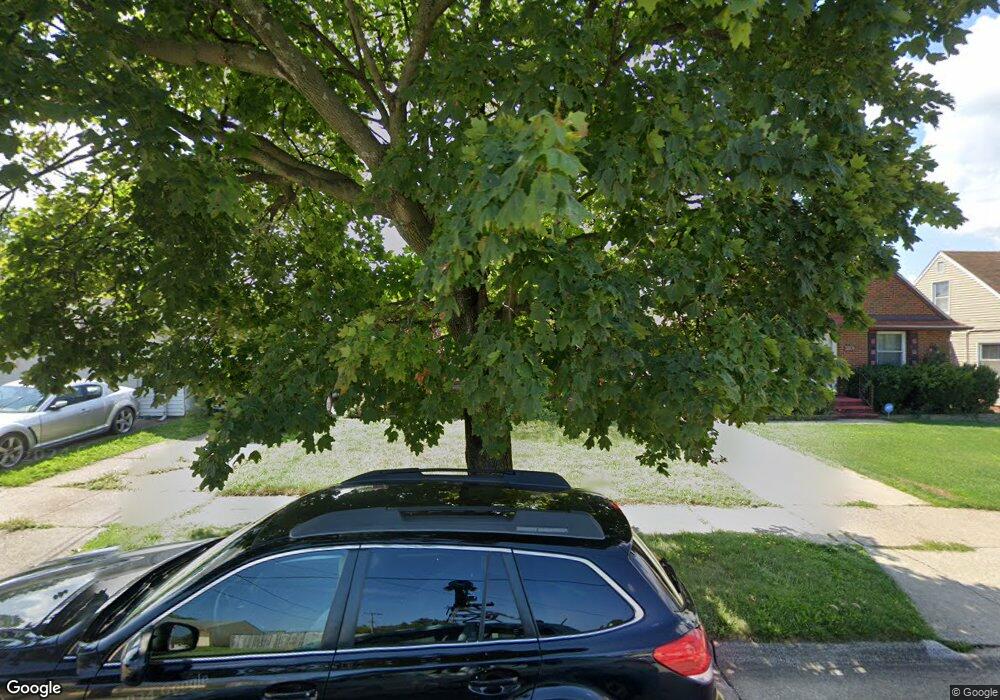
5409 Gifford Ave Cleveland, OH 44144
Old Brooklyn NeighborhoodEstimated Value: $150,269 - $169,000
2
Beds
1
Bath
875
Sq Ft
$183/Sq Ft
Est. Value
About This Home
This home is located at 5409 Gifford Ave, Cleveland, OH 44144 and is currently estimated at $160,067, approximately $182 per square foot. 5409 Gifford Ave is a home located in Cuyahoga County with nearby schools including Benjamin Franklin, Almira Academy, and Artemus Ward School.
Ownership History
Date
Name
Owned For
Owner Type
Purchase Details
Closed on
May 1, 2001
Sold by
Manson Robert
Bought by
Corrigan Kim M
Current Estimated Value
Home Financials for this Owner
Home Financials are based on the most recent Mortgage that was taken out on this home.
Original Mortgage
$90,538
Outstanding Balance
$33,606
Interest Rate
6.95%
Mortgage Type
FHA
Estimated Equity
$126,461
Purchase Details
Closed on
Apr 28, 1998
Sold by
Allen Hana B
Bought by
Manson Robert
Home Financials for this Owner
Home Financials are based on the most recent Mortgage that was taken out on this home.
Original Mortgage
$57,000
Interest Rate
7.2%
Purchase Details
Closed on
Apr 16, 1998
Sold by
Allen William A
Bought by
Allen Hana B
Home Financials for this Owner
Home Financials are based on the most recent Mortgage that was taken out on this home.
Original Mortgage
$57,000
Interest Rate
7.2%
Purchase Details
Closed on
Dec 18, 1990
Sold by
Lablanca E Leanor
Bought by
Allen William A
Purchase Details
Closed on
Jan 1, 1975
Bought by
Lablanca E Leanor
Create a Home Valuation Report for This Property
The Home Valuation Report is an in-depth analysis detailing your home's value as well as a comparison with similar homes in the area
Home Values in the Area
Average Home Value in this Area
Purchase History
| Date | Buyer | Sale Price | Title Company |
|---|---|---|---|
| Corrigan Kim M | $92,000 | Executive Title Agency Corp | |
| Manson Robert | $74,000 | Transcounty Title Agency Inc | |
| Allen Hana B | -- | Transcounty Title Agency Inc | |
| Allen William A | $57,000 | -- | |
| Lablanca E Leanor | -- | -- |
Source: Public Records
Mortgage History
| Date | Status | Borrower | Loan Amount |
|---|---|---|---|
| Open | Corrigan Kim M | $90,538 | |
| Closed | Manson Robert | $57,000 |
Source: Public Records
Tax History Compared to Growth
Tax History
| Year | Tax Paid | Tax Assessment Tax Assessment Total Assessment is a certain percentage of the fair market value that is determined by local assessors to be the total taxable value of land and additions on the property. | Land | Improvement |
|---|---|---|---|---|
| 2024 | $2,703 | $41,230 | $9,345 | $31,885 |
| 2023 | $2,496 | $32,910 | $6,690 | $26,220 |
| 2022 | $2,482 | $32,900 | $6,690 | $26,220 |
| 2021 | $2,457 | $32,900 | $6,690 | $26,220 |
| 2020 | $2,204 | $25,520 | $5,180 | $20,340 |
| 2019 | $2,038 | $72,900 | $14,800 | $58,100 |
| 2018 | $2,003 | $25,520 | $5,180 | $20,340 |
| 2017 | $1,991 | $24,150 | $4,550 | $19,600 |
| 2016 | $1,976 | $24,150 | $4,550 | $19,600 |
| 2015 | $2,205 | $24,150 | $4,550 | $19,600 |
| 2014 | $2,205 | $26,850 | $5,040 | $21,810 |
Source: Public Records
Map
Nearby Homes
- 4484 W 53rd St
- 4456 W 49th St
- 5105 Behrwald Ave
- 4373 W 52nd St
- 4427 W 49th St
- 4811 Ardmore Ave
- 4615 Ardmore Ave
- 5714 Stickney Ave
- 4520 Wichita Ave
- 5701 Stickney Ave
- 4510 Woburn Ave
- 4329 Ardmore Ave
- 4215 W 58th St
- 5902 Vandalia Ave
- 6015 Ira Ave
- 4581 Pearl Rd
- 4315 Stickney Ave
- 4102 Spokane Ave
- 4002 Ardmore Ave
- 7420 Outlook Ave
- 5501 Gifford Ave
- 5505 Gifford Ave
- 4508 Fulton Rd
- 4512 Fulton Rd
- 4504 Fulton Rd
- 4516 Fulton Rd
- 5601 Gifford Ave
- 5412 Wichita Ave
- 4520 Fulton Rd
- 4495 W 56th St
- 5416 Wichita Ave
- 5605 Gifford Ave
- 4494 Fulton Rd
- 5502 Wichita Ave
- 4524 Fulton Rd
- 4491 W 56th St
- 5609 Gifford Ave
- 5506 Wichita Ave
- 4492 Fulton Rd
- 4487 W 56th St