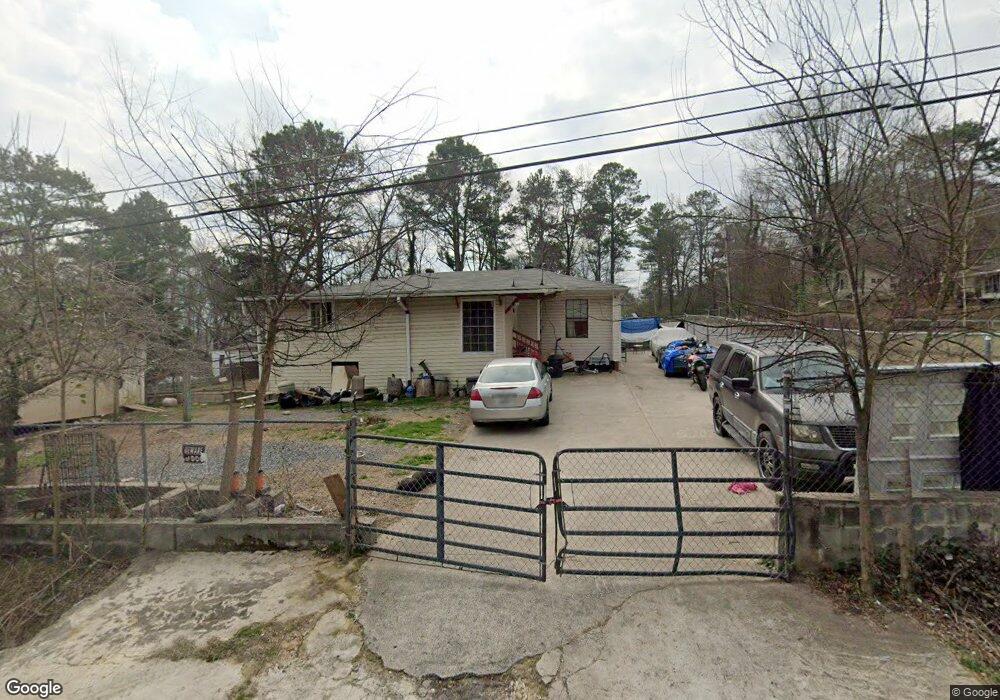
541 Brock Dr NW Dalton, GA 30720
Estimated Value: $171,000 - $300,000
3
Beds
2
Baths
1,200
Sq Ft
$182/Sq Ft
Est. Value
About This Home
This home is located at 541 Brock Dr NW, Dalton, GA 30720 and is currently estimated at $218,762, approximately $182 per square foot. 541 Brock Dr NW is a home located in Whitfield County with nearby schools including Pleasant Grove Elementary School, New Hope Middle School, and Northwest Whitfield County High School.
Ownership History
Date
Name
Owned For
Owner Type
Purchase Details
Closed on
Dec 21, 2011
Bought by
Landaverde German
Current Estimated Value
Purchase Details
Closed on
Aug 2, 2011
Sold by
Ramirez Oscar Resendiz
Bought by
Suntrust Bank
Purchase Details
Closed on
Jan 20, 2005
Sold by
Not Provided
Bought by
Ramirez Oscar Resendiz
Home Financials for this Owner
Home Financials are based on the most recent Mortgage that was taken out on this home.
Original Mortgage
$66,600
Interest Rate
8.5%
Mortgage Type
New Conventional
Purchase Details
Closed on
Aug 11, 2004
Sold by
Heckman Properties Inc
Bought by
Jones Michael S and Jones Vickie L
Purchase Details
Closed on
Jul 12, 2004
Sold by
Chase Manhattan Bank
Bought by
Heckman Properties Inc
Purchase Details
Closed on
Nov 4, 2003
Sold by
Walker Ronnie
Bought by
The Chase Manhattan Bank
Purchase Details
Closed on
Dec 1, 1996
Bought by
Walker Ronnie
Create a Home Valuation Report for This Property
The Home Valuation Report is an in-depth analysis detailing your home's value as well as a comparison with similar homes in the area
Home Values in the Area
Average Home Value in this Area
Purchase History
| Date | Buyer | Sale Price | Title Company |
|---|---|---|---|
| Landaverde German | $25,000 | -- | |
| Suntrust Bank | $38,250 | -- | |
| Ramirez Oscar Resendiz | $74,000 | -- | |
| Jones Michael S | $34,000 | -- | |
| Heckman Properties Inc | $24,000 | -- | |
| The Chase Manhattan Bank | -- | -- | |
| Walker Ronnie | $37,500 | -- |
Source: Public Records
Mortgage History
| Date | Status | Borrower | Loan Amount |
|---|---|---|---|
| Previous Owner | Ramirez Oscar Resendiz | $66,600 |
Source: Public Records
Tax History Compared to Growth
Tax History
| Year | Tax Paid | Tax Assessment Tax Assessment Total Assessment is a certain percentage of the fair market value that is determined by local assessors to be the total taxable value of land and additions on the property. | Land | Improvement |
|---|---|---|---|---|
| 2024 | $1,182 | $67,378 | $8,000 | $59,378 |
| 2023 | $1,182 | $39,306 | $3,780 | $35,526 |
| 2022 | $74 | $26,895 | $3,780 | $23,115 |
| 2021 | $74 | $26,895 | $3,780 | $23,115 |
| 2020 | $81 | $26,895 | $3,780 | $23,115 |
| 2019 | $84 | $26,895 | $3,780 | $23,115 |
| 2018 | $80 | $26,259 | $3,780 | $22,479 |
| 2017 | $80 | $26,259 | $3,780 | $22,479 |
| 2016 | $49 | $24,225 | $3,780 | $20,445 |
| 2014 | $34 | $24,225 | $3,780 | $20,445 |
| 2013 | -- | $24,224 | $3,780 | $20,444 |
Source: Public Records
Map
Nearby Homes
- 1903 Summit View Dr
- 1899 Middle Summit Dr Unit 98
- 1903 Middle Summit Dr
- 1899 N Summit Dr Unit 66
- 1614 Waring Rd NW
- 1706 Chestnut Oak Dr Unit 90
- 1699 Pin Oak Dr Unit 133
- 1709 Willow Oak Ln Unit 53
- 1702 Chestnut Oak Dr
- 1702 Chestnut Oak Dr Unit 83
- 1699 Burnt Oak Dr Unit 195
- 1699 Burnt Oak Dr
- 000 Reed Rd
- 503 Moore Dr
- 1696 Red Oak Dr Unit 184
- 1696 Red Oak Dr
- 1696 Red Oak Dr Unit 181
- 1600 Puryear Dr NW
- 1713 Brighton Way
- 1730 Brighton Way
- 1832 Crabapple Dr NW
- 539 Brock Dr NW
- 1827 Swanson Dr NW
- 1830 Crabapple Dr NW
- 543 Brock Dr NW
- 1831 Crabapple Dr NW
- 540 Brock Dr NW
- 1802 Swanson Dr NW
- 1821 Swanson Dr NW Unit 1
- 1821 Swanson Dr NW
- 1832 Susan Dr NW
- 1817 Swanson Dr NW
- 1821 Crabapple Dr NW Unit 21,PL15
- 1830 Susan Dr NW
- 1820 Susan Dr NW
- 572 Brock Dr NW
- 1829 Susan Dr NW
- 1811 Swanson Dr NW
- 1827 Susan Dr NW
- 1828 Susan Dr NW