Estimated Value: $537,000 - $603,000
3
Beds
3
Baths
1,446
Sq Ft
$396/Sq Ft
Est. Value
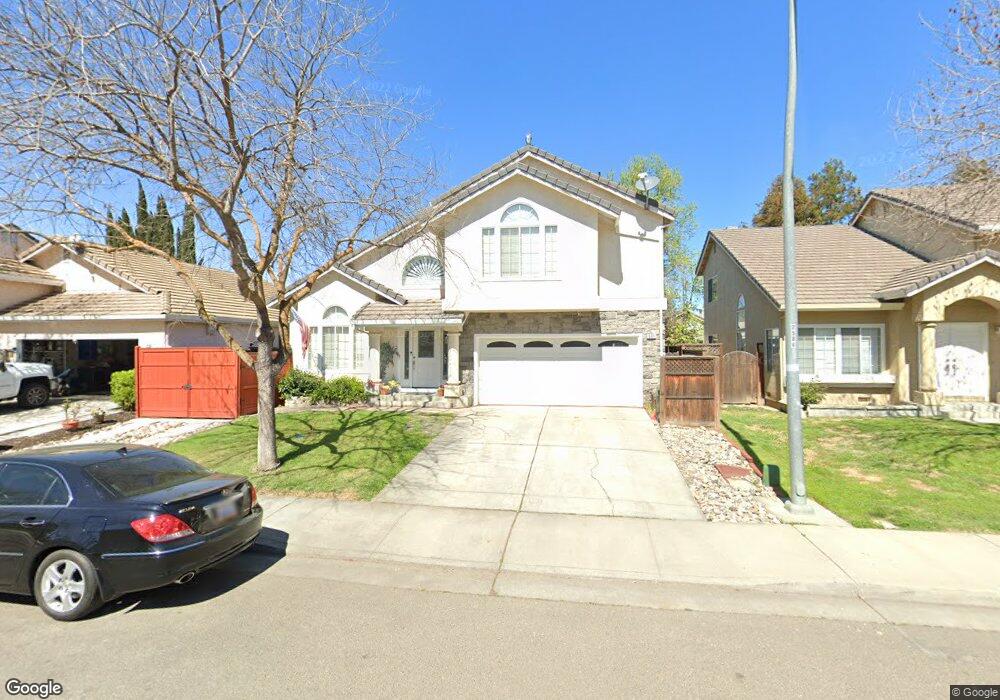
About This Home
This home is located at 541 Czerny St, Tracy, CA 95376 and is currently estimated at $572,910, approximately $396 per square foot. 541 Czerny St is a home located in San Joaquin County with nearby schools including Louis A. Bohn Elementary School, Earle E. Williams Middle School, and Tracy High School.
Ownership History
Date
Name
Owned For
Owner Type
Purchase Details
Closed on
Mar 23, 2004
Sold by
Acosta Gail P and Acosta Darren P
Bought by
Acosta Darren P and Acosta Gail P
Current Estimated Value
Home Financials for this Owner
Home Financials are based on the most recent Mortgage that was taken out on this home.
Original Mortgage
$266,400
Outstanding Balance
$123,631
Interest Rate
5.57%
Mortgage Type
New Conventional
Estimated Equity
$449,279
Purchase Details
Closed on
Sep 25, 2000
Sold by
Acosta Darren and Acosta Gail
Bought by
Acosta Darren P and Acosta Gail P
Home Financials for this Owner
Home Financials are based on the most recent Mortgage that was taken out on this home.
Original Mortgage
$171,000
Interest Rate
7.98%
Purchase Details
Closed on
Aug 23, 1994
Sold by
Acosta Richard L
Bought by
Acosta Elvira Lopez
Purchase Details
Closed on
Jun 21, 1994
Sold by
Acosta Richard L and Acosta Maria S N
Bought by
Acosta Richard L and Acosta Maria S N
Create a Home Valuation Report for This Property
The Home Valuation Report is an in-depth analysis detailing your home's value as well as a comparison with similar homes in the area
Home Values in the Area
Average Home Value in this Area
Purchase History
We collect this data history from publicly available records. To have your information removed, we recommend requesting removal directly through your county’s website.
| Date | Buyer | Sale Price | Title Company |
|---|---|---|---|
| Acosta Darren P | -- | Fidelity Natl Title Ins Co | |
| Acosta Darren P | $171,000 | Fidelity National Title Co | |
| Acosta Elvira Lopez | -- | -- | |
| Acosta Richard L | -- | -- |
Source: Public Records
Mortgage History
We collect this data history from publicly available records. To have your information removed, we recommend requesting removal directly through your county’s website.
| Date | Status | Borrower | Loan Amount |
|---|---|---|---|
| Open | Acosta Darren P | $266,400 | |
| Closed | Acosta Darren P | $171,000 |
Source: Public Records
Tax History
| Year | Tax Paid | Tax Assessment Tax Assessment Total Assessment is a certain percentage of the fair market value that is determined by local assessors to be the total taxable value of land and additions on the property. | Land | Improvement |
|---|---|---|---|---|
| 2025 | $4,011 | $335,449 | $144,523 | $190,926 |
| 2024 | $3,705 | $328,873 | $141,690 | $187,183 |
| 2023 | $3,643 | $322,425 | $138,912 | $183,513 |
| 2022 | $3,566 | $316,104 | $136,189 | $179,915 |
| 2021 | $3,520 | $309,907 | $133,519 | $176,388 |
| 2020 | $3,494 | $306,730 | $132,150 | $174,580 |
| 2019 | $3,435 | $300,716 | $129,559 | $171,157 |
| 2018 | $3,615 | $294,820 | $127,019 | $167,801 |
| 2017 | $3,450 | $289,040 | $124,529 | $164,511 |
| 2016 | $3,476 | $283,373 | $122,087 | $161,286 |
| 2014 | $3,278 | $273,652 | $117,899 | $155,753 |
Source: Public Records
Map
Nearby Homes
- 550 Gonzalez St
- 420 Falcon Ct
- 225 Pacheco Dr
- 216 E 12th St
- 114 C St
- 18 W 8th St
- 810 Joranollo Dr
- 110 Loma Prieta Cir
- 417 E Eaton Ave
- 213 W South St
- 1203 Adam St
- 1465 Franklin Ave
- 929 Kapareil Dr
- 544 Rockingham Ct
- 448 Burlington Dr
- 1183 Sultana Dr
- 360 Mount Oso Ave
- 1243 Parker Ave Unit 2
- 216 E Carlton Way
- 1245 Parker Ave Unit 3
Your Personal Tour Guide
Ask me questions while you tour the home.