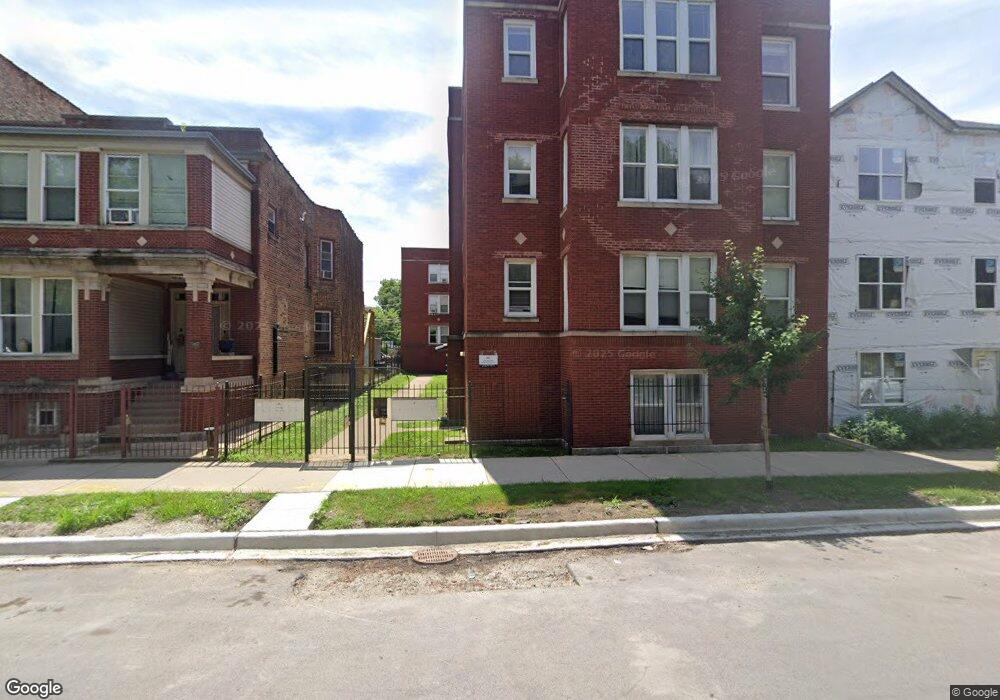
541 E 60th St Unit 5412 Chicago, IL 60637
Washington Park NeighborhoodEstimated Value: $114,251 - $176,000
2
Beds
1
Bath
900
Sq Ft
$147/Sq Ft
Est. Value
About This Home
This home is located at 541 E 60th St Unit 5412, Chicago, IL 60637 and is currently estimated at $132,563, approximately $147 per square foot. 541 E 60th St Unit 5412 is a home located in Cook County with nearby schools including Fiske Elementary School, Hyde Park Academy High School, and CICS Washington Park.
Ownership History
Date
Name
Owned For
Owner Type
Purchase Details
Closed on
Dec 6, 2017
Sold by
Ollana Llc
Bought by
Brans Llc
Current Estimated Value
Purchase Details
Closed on
Sep 20, 2017
Sold by
Mendak Keith D and Federal National Mortgage Asso
Bought by
Ollana Llc
Purchase Details
Closed on
Jun 22, 2004
Sold by
Adewole Olukayode
Bought by
Mendak Keith D
Home Financials for this Owner
Home Financials are based on the most recent Mortgage that was taken out on this home.
Original Mortgage
$55,000
Interest Rate
6.1%
Mortgage Type
Purchase Money Mortgage
Purchase Details
Closed on
Apr 27, 2001
Sold by
First Chicago Nbd Mtg Company
Bought by
Adewole Olukayode
Home Financials for this Owner
Home Financials are based on the most recent Mortgage that was taken out on this home.
Original Mortgage
$51,300
Interest Rate
7.03%
Purchase Details
Closed on
Mar 10, 1998
Sold by
Beckett John A and Beckett Leslie Kleiman
Bought by
Parnell Willie and Hawkins Alina
Create a Home Valuation Report for This Property
The Home Valuation Report is an in-depth analysis detailing your home's value as well as a comparison with similar homes in the area
Home Values in the Area
Average Home Value in this Area
Purchase History
| Date | Buyer | Sale Price | Title Company |
|---|---|---|---|
| Brans Llc | $112,000 | Attorneys Title Guaranty Fun | |
| Ollana Llc | $33,000 | Attorneys Title Guaranty Fun | |
| Mendak Keith D | $75,000 | Multiple | |
| Adewole Olukayode | -- | -- | |
| Parnell Willie | $72,500 | -- |
Source: Public Records
Mortgage History
| Date | Status | Borrower | Loan Amount |
|---|---|---|---|
| Previous Owner | Mendak Keith D | $55,000 | |
| Previous Owner | Adewole Olukayode | $51,300 |
Source: Public Records
Tax History
| Year | Tax Paid | Tax Assessment Tax Assessment Total Assessment is a certain percentage of the fair market value that is determined by local assessors to be the total taxable value of land and additions on the property. | Land | Improvement |
|---|---|---|---|---|
| 2025 | $529 | $8,356 | $660 | $7,696 |
| 2024 | $529 | $8,356 | $660 | $7,696 |
| 2023 | $516 | $2,500 | $660 | $1,840 |
| 2022 | $516 | $2,500 | $660 | $1,840 |
| 2021 | $504 | $2,499 | $660 | $1,839 |
| 2020 | $663 | $2,975 | $660 | $2,315 |
| 2019 | $663 | $3,300 | $660 | $2,640 |
| 2018 | $652 | $3,300 | $660 | $2,640 |
| 2017 | $768 | $3,569 | $580 | $2,989 |
| 2016 | $715 | $3,569 | $580 | $2,989 |
| 2015 | $654 | $3,569 | $580 | $2,989 |
| 2014 | $1,179 | $6,352 | $475 | $5,877 |
| 2013 | $1,155 | $6,352 | $475 | $5,877 |
Source: Public Records
Map
Nearby Homes
- 541 E 60th St Unit 1
- 609 E 60th St
- 6035 S St Lawrence Ave Unit GS
- 532 E 61st St
- 6049 S Saint Lawrence Ave
- 6043 S Eberhart Ave
- 6052 S Rhodes Ave
- 6037 S Champlain Ave
- 6049 S Champlain Ave
- 6111 S Eberhart Ave
- 6149 S Rhodes Ave
- 6148 S Rhodes Ave
- 6112 S Vernon Ave
- 6149 S Vernon Ave
- 5930 S King Dr
- 5906 S King Dr Unit A3
- 5900 S King Dr Unit 3
- 5900 S King Dr Unit 59002
- 6230 S Langley Ave
- 5942 S Calumet Ave
- 541 E 60th St Unit 3
- 541 E 60th St Unit 5432
- 541 E 60th St Unit 5414
- 541 E 60th St Unit 5452
- 541 E 60th St Unit 545
- 541 E 60th St Unit 5433
- 541 E 60th St Unit 5431
- 541 E 60th St Unit 5413
- 541 E 60th St Unit 5411
- 541 E 60th St Unit 5454
- 541 E 60th St Unit 545
- 541 E 60th St Unit 5434
- 541 E 60th St Unit 5453
- 541 E 60th St Unit 545
- 541 E 60th St Unit 2
- 541 E 60th St Unit 4
- 543 E 60th St Unit 1
- 543 E 60th St
- 543 E 60th St Unit 8
- 545 E 60th St Unit 545
Your Personal Tour Guide
Ask me questions while you tour the home.