541 Laurel Rd Crossville, TN 38555
Estimated Value: $327,000 - $486,000
--
Bed
4
Baths
2,252
Sq Ft
$180/Sq Ft
Est. Value
About This Home
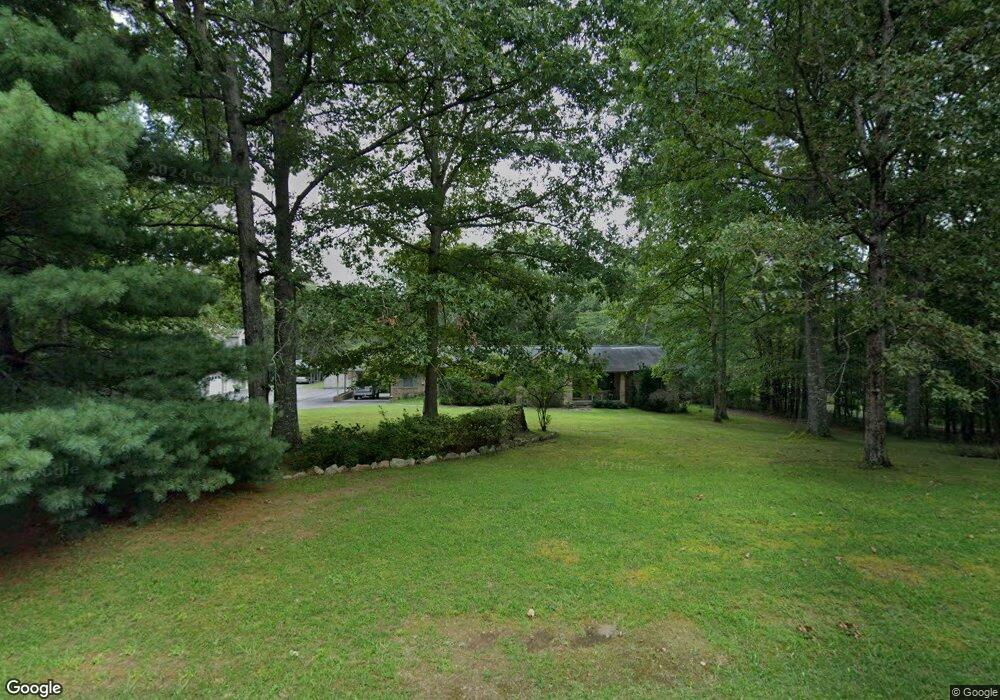
This home is located at 541 Laurel Rd, Crossville, TN 38555 and is currently estimated at $404,955, approximately $179 per square foot. 541 Laurel Rd is a home located in Cumberland County with nearby schools including South Cumberland Elementary School and Cumberland County High School.
Ownership History
Date
Name
Owned For
Owner Type
Purchase Details
Closed on
Sep 8, 2003
Sold by
Burnett Kenneth B
Bought by
Riches Walter A
Current Estimated Value
Purchase Details
Closed on
Jun 20, 2003
Sold by
Hunter Betty Heard
Bought by
Burnett Kenneth B
Purchase Details
Closed on
Jan 17, 2001
Sold by
Parks Joni L
Bought by
Heard Frank
Purchase Details
Closed on
Oct 6, 1997
Sold by
Cotter Frankie
Bought by
Barbosa Steven J
Purchase Details
Closed on
Feb 26, 1997
Bought by
Parks Joni L
Purchase Details
Closed on
Oct 21, 1996
Sold by
Garrett Billy G Inc
Bought by
Cotter Frankie
Create a Home Valuation Report for This Property
The Home Valuation Report is an in-depth analysis detailing your home's value as well as a comparison with similar homes in the area
Home Values in the Area
Average Home Value in this Area
Purchase History
| Date | Buyer | Sale Price | Title Company |
|---|---|---|---|
| Riches Walter A | $125,900 | -- | |
| Burnett Kenneth B | -- | -- | |
| Burnett Kenneth B | $85,000 | -- | |
| Heard Frank | $30,000 | -- | |
| Heard Frank | $65,000 | -- | |
| Barbosa Steven J | $18,500 | -- | |
| Parks Joni L | $20,000 | -- | |
| Cotter Frankie | $8,000 | -- |
Source: Public Records
Tax History Compared to Growth
Tax History
| Year | Tax Paid | Tax Assessment Tax Assessment Total Assessment is a certain percentage of the fair market value that is determined by local assessors to be the total taxable value of land and additions on the property. | Land | Improvement |
|---|---|---|---|---|
| 2024 | $940 | $82,800 | $19,275 | $63,525 |
| 2023 | $940 | $82,800 | $0 | $0 |
| 2022 | $940 | $82,800 | $19,275 | $63,525 |
| 2021 | $959 | $61,275 | $15,675 | $45,600 |
| 2020 | $959 | $61,275 | $15,675 | $45,600 |
| 2019 | $959 | $61,275 | $15,675 | $45,600 |
| 2018 | $959 | $61,275 | $15,675 | $45,600 |
| 2017 | $959 | $61,275 | $15,675 | $45,600 |
| 2016 | $478 | $31,275 | $13,125 | $18,150 |
| 2015 | $468 | $31,275 | $13,125 | $18,150 |
| 2014 | $468 | $31,283 | $0 | $0 |
Source: Public Records
Map
Nearby Homes