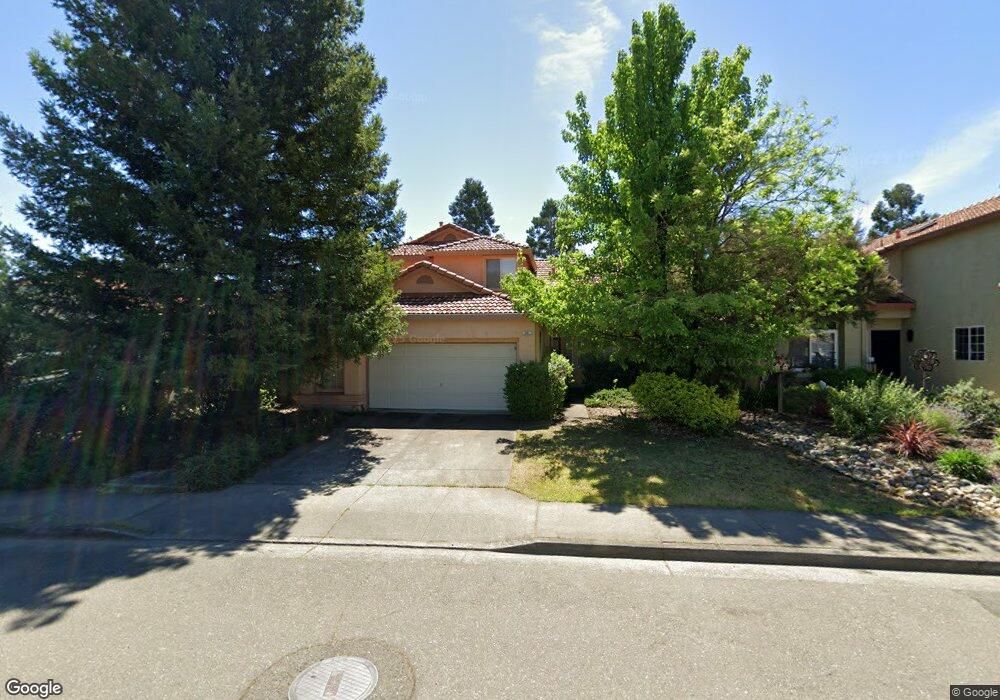
541 Monaco Cir Cloverdale, CA 95425
Estimated Value: $656,636 - $906,000
3
Beds
3
Baths
1,788
Sq Ft
$420/Sq Ft
Est. Value
About This Home
This home is located at 541 Monaco Cir, Cloverdale, CA 95425 and is currently estimated at $751,409, approximately $420 per square foot. 541 Monaco Cir is a home located in Sonoma County with nearby schools including Jefferson Elementary School, Washington School, and Cloverdale High School.
Ownership History
Date
Name
Owned For
Owner Type
Purchase Details
Closed on
Feb 7, 2002
Sold by
Felix Joshua M and Felix Sharmila
Bought by
Freeborn Martin
Current Estimated Value
Home Financials for this Owner
Home Financials are based on the most recent Mortgage that was taken out on this home.
Original Mortgage
$255,000
Outstanding Balance
$105,961
Interest Rate
7.13%
Estimated Equity
$645,448
Purchase Details
Closed on
Jun 19, 2001
Sold by
Larson Bryan Gordon Lee and Larson Bryan Frances
Bought by
Felix Joshua M and Felix Sharmila
Purchase Details
Closed on
Feb 14, 1994
Sold by
Jefferson Springs
Bought by
Larson Bryan Gordon Lee and Larson Bryan Frances
Home Financials for this Owner
Home Financials are based on the most recent Mortgage that was taken out on this home.
Original Mortgage
$40,000
Interest Rate
3.75%
Create a Home Valuation Report for This Property
The Home Valuation Report is an in-depth analysis detailing your home's value as well as a comparison with similar homes in the area
Home Values in the Area
Average Home Value in this Area
Purchase History
| Date | Buyer | Sale Price | Title Company |
|---|---|---|---|
| Freeborn Martin | $340,000 | Fidelity National Title Co | |
| Felix Joshua M | $640,000 | North Bay Title Co | |
| Larson Bryan Gordon Lee | $187,000 | Chicago Title Company |
Source: Public Records
Mortgage History
| Date | Status | Borrower | Loan Amount |
|---|---|---|---|
| Open | Freeborn Martin | $255,000 | |
| Previous Owner | Larson Bryan Gordon Lee | $40,000 |
Source: Public Records
Tax History Compared to Growth
Tax History
| Year | Tax Paid | Tax Assessment Tax Assessment Total Assessment is a certain percentage of the fair market value that is determined by local assessors to be the total taxable value of land and additions on the property. | Land | Improvement |
|---|---|---|---|---|
| 2025 | $6,235 | $502,276 | $110,789 | $391,487 |
| 2024 | $6,235 | $492,428 | $108,617 | $383,811 |
| 2023 | $6,235 | $482,774 | $106,488 | $376,286 |
| 2022 | $6,118 | $473,308 | $104,400 | $368,908 |
| 2021 | $6,041 | $464,028 | $102,353 | $361,675 |
| 2020 | $6,023 | $459,271 | $101,304 | $357,967 |
| 2019 | $5,910 | $450,267 | $99,318 | $350,949 |
| 2018 | $5,563 | $441,439 | $97,371 | $344,068 |
| 2017 | $5,473 | $432,784 | $95,462 | $337,322 |
| 2016 | $5,373 | $424,299 | $93,591 | $330,708 |
| 2015 | $5,123 | $417,927 | $92,186 | $325,741 |
| 2014 | $4,362 | $357,000 | $79,000 | $278,000 |
Source: Public Records
Map
Nearby Homes
- 0 Venezia Way
- 110 Shahan Dr
- 530 N Cloverdale Blvd
- 504 N Cloverdale Blvd Unit 1
- 113 Heidi Ln
- 0 University St Unit A
- 0 University St Unit B
- 113 E 4th St
- 615 Antonio St
- 593 W 2nd St
- 303 W 2nd St
- 209 E 1st St
- 175 Stonegate Cir Unit C
- 180 Healdsburg Ave Unit B
- 180 Healdsburg Ave Unit A
- 110 Syrah Ct
- 112 Zinfandel Ct
- 451 Healdsburg Ave
- 118 Garden Circle Way
- 12 Alana Way
- 543 Monaco Cir
- 505 Venezia Way
- 545 Monaco Cir
- 507 Venezia Way
- 547 Monaco Cir
- 548 Monaco Cir
- 509 Venezia Way
- 506 Venezia Way
- 549 Monaco Cir
- 510 Venezia Way
- 551 Monaco Cir
- 511 Venezia Way
- 550 Monaco Cir
- 512 Venezia Way
- 553 Monaco Cir
- 550 N Jefferson St
- 552 Monaco Cir
- 513 Venezia Way
- 514 Venezia Way
- 504 Venezia Way