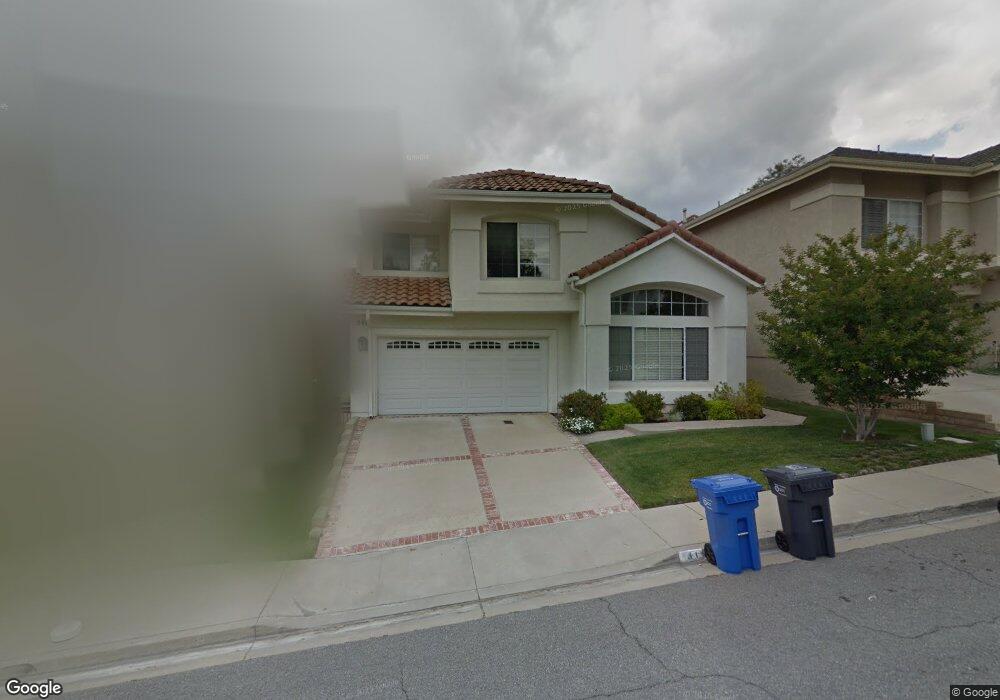
541 Myrtle Ct Oak Park, CA 91377
Estimated Value: $1,195,000 - $1,348,000
3
Beds
3
Baths
2,095
Sq Ft
$598/Sq Ft
Est. Value
About This Home
This home is located at 541 Myrtle Ct, Oak Park, CA 91377 and is currently estimated at $1,253,731, approximately $598 per square foot. 541 Myrtle Ct is a home located in Ventura County with nearby schools including Medea Creek Middle School and Oak Park High School.
Ownership History
Date
Name
Owned For
Owner Type
Purchase Details
Closed on
Aug 7, 2007
Sold by
Eng Leslie J and Eng Shelley L
Bought by
Handy Joann and Handy Keith B
Current Estimated Value
Home Financials for this Owner
Home Financials are based on the most recent Mortgage that was taken out on this home.
Original Mortgage
$600,000
Outstanding Balance
$381,440
Interest Rate
6.74%
Mortgage Type
Purchase Money Mortgage
Estimated Equity
$872,291
Purchase Details
Closed on
Feb 2, 2004
Sold by
Eng Leslie J
Bought by
Eng Leslie J and Eng Shelley L
Purchase Details
Closed on
Nov 6, 2002
Sold by
Eng Leslie J
Bought by
Eng Leslie J
Home Financials for this Owner
Home Financials are based on the most recent Mortgage that was taken out on this home.
Original Mortgage
$300,000
Interest Rate
6.06%
Purchase Details
Closed on
Oct 1, 2002
Sold by
Eng Leslie J and Eng Ellen
Bought by
Eng Leslie J
Home Financials for this Owner
Home Financials are based on the most recent Mortgage that was taken out on this home.
Original Mortgage
$300,000
Interest Rate
6.06%
Create a Home Valuation Report for This Property
The Home Valuation Report is an in-depth analysis detailing your home's value as well as a comparison with similar homes in the area
Home Values in the Area
Average Home Value in this Area
Purchase History
We collect this data history from publicly available records. To have your information removed, we recommend requesting removal directly through your county’s website.
| Date | Buyer | Sale Price | Title Company |
|---|---|---|---|
| Handy Joann | $750,000 | Stewart Title | |
| Eng Leslie J | -- | -- | |
| Eng Leslie J | -- | First American Title Ins Co | |
| Eng Leslie J | -- | -- |
Source: Public Records
Mortgage History
We collect this data history from publicly available records. To have your information removed, we recommend requesting removal directly through your county’s website.
| Date | Status | Borrower | Loan Amount |
|---|---|---|---|
| Open | Handy Joann | $600,000 | |
| Previous Owner | Eng Leslie J | $300,000 |
Source: Public Records
Tax History
| Year | Tax Paid | Tax Assessment Tax Assessment Total Assessment is a certain percentage of the fair market value that is determined by local assessors to be the total taxable value of land and additions on the property. | Land | Improvement |
|---|---|---|---|---|
| 2025 | $12,549 | $985,127 | $640,336 | $344,791 |
| 2024 | $12,549 | $965,811 | $627,780 | $338,031 |
| 2023 | $12,478 | $946,874 | $615,471 | $331,403 |
| 2022 | $11,962 | $928,308 | $603,403 | $324,905 |
| 2021 | $11,573 | $910,106 | $591,571 | $318,535 |
| 2020 | $11,458 | $900,776 | $585,506 | $315,270 |
| 2019 | $11,000 | $883,115 | $574,026 | $309,089 |
| 2018 | $10,747 | $865,800 | $562,771 | $303,029 |
| 2017 | $10,017 | $807,000 | $524,000 | $283,000 |
| 2016 | $9,704 | $779,000 | $506,000 | $273,000 |
| 2015 | $9,668 | $757,000 | $492,000 | $265,000 |
| 2014 | $8,790 | $676,000 | $439,000 | $237,000 |
Source: Public Records
Map
Nearby Homes
- 5009 Blackpool Ave
- 5038 Durant Ct
- 445 Cremona Way
- 5133 Pesto Way
- 4933 Santo Dr
- 327 Savoy Ct
- 493 Messina Place
- 4786 Saltino Way
- 5423 Spanish Oak Ln Unit C
- 5750 Ingram Place
- 4797 Taranto Way
- 513 Water Oak Ln Unit B
- 349 Scanno Dr
- 602 Calle Mirador
- 599 Calle de Las Ovejas
- 756 Cedar Point Place
- 583 Calle de Las Ovejas
- 576 Calle de Las Ovejas
- 984 Cedarcliff Ct
- 653 Oak Run Trail Unit 109
Your Personal Tour Guide
Ask me questions while you tour the home.