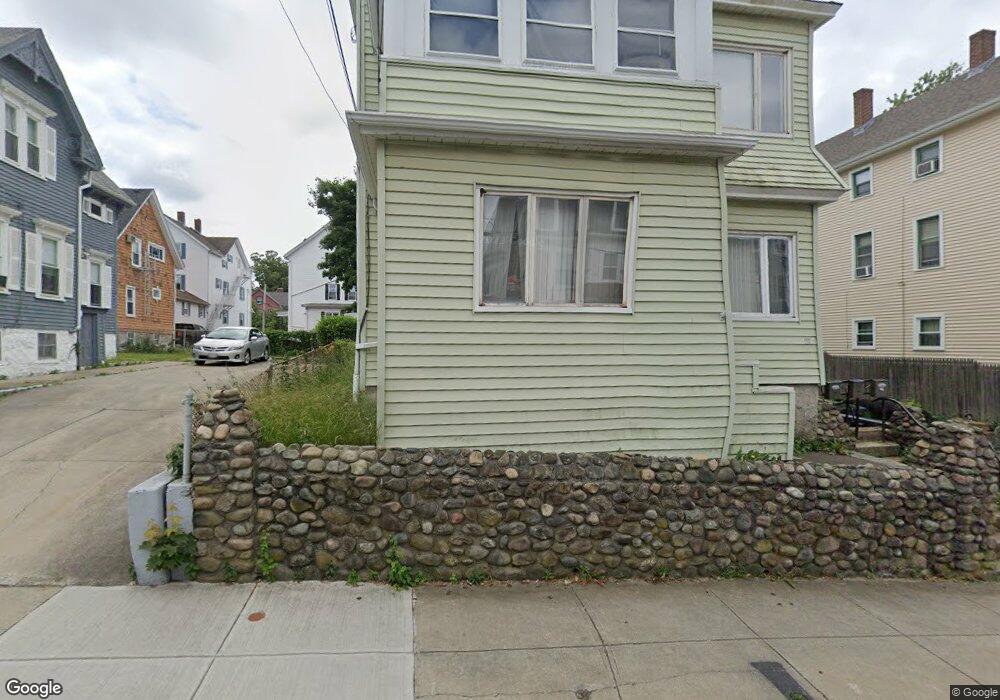
541 Osborn St Fall River, MA 02724
Father Kelly NeighborhoodEstimated Value: $528,000 - $644,000
8
Beds
3
Baths
3,021
Sq Ft
$194/Sq Ft
Est. Value
About This Home
This home is located at 541 Osborn St, Fall River, MA 02724 and is currently estimated at $585,501, approximately $193 per square foot. 541 Osborn St is a home located in Bristol County with nearby schools including Henry Lord Community School, B M C Durfee High School, and Argosy Collegiate Charter School.
Ownership History
Date
Name
Owned For
Owner Type
Purchase Details
Closed on
Oct 20, 2010
Sold by
Lowney David P and Lowney Nancy
Bought by
Lowney David P and Lowney Nancy
Current Estimated Value
Home Financials for this Owner
Home Financials are based on the most recent Mortgage that was taken out on this home.
Original Mortgage
$155,999
Outstanding Balance
$101,426
Interest Rate
4.37%
Mortgage Type
FHA
Estimated Equity
$484,075
Purchase Details
Closed on
Apr 17, 2007
Sold by
Lowney David P and Ray Nancy
Bought by
Lowney David P and Lowney Nancy
Home Financials for this Owner
Home Financials are based on the most recent Mortgage that was taken out on this home.
Original Mortgage
$260,000
Interest Rate
6.24%
Mortgage Type
Purchase Money Mortgage
Purchase Details
Closed on
Sep 24, 2002
Sold by
Rua Gil S and Rua Eileen M
Bought by
Lowney David P and Ray Nancy
Home Financials for this Owner
Home Financials are based on the most recent Mortgage that was taken out on this home.
Original Mortgage
$142,100
Interest Rate
6.36%
Mortgage Type
Purchase Money Mortgage
Create a Home Valuation Report for This Property
The Home Valuation Report is an in-depth analysis detailing your home's value as well as a comparison with similar homes in the area
Home Values in the Area
Average Home Value in this Area
Purchase History
| Date | Buyer | Sale Price | Title Company |
|---|---|---|---|
| Lowney David P | -- | -- | |
| Lowney David P | -- | -- | |
| Lowney David P | $225,000 | -- |
Source: Public Records
Mortgage History
| Date | Status | Borrower | Loan Amount |
|---|---|---|---|
| Open | Lowney David P | $155,999 | |
| Closed | Lowney David P | $64,001 | |
| Previous Owner | Lowney David P | $260,000 | |
| Previous Owner | Lowney David P | $65,000 | |
| Previous Owner | Lowney David P | $21,547 | |
| Previous Owner | Lowney David P | $142,100 | |
| Previous Owner | Lowney David P | $50,000 |
Source: Public Records
Tax History
| Year | Tax Paid | Tax Assessment Tax Assessment Total Assessment is a certain percentage of the fair market value that is determined by local assessors to be the total taxable value of land and additions on the property. | Land | Improvement |
|---|---|---|---|---|
| 2025 | $5,356 | $467,800 | $108,200 | $359,600 |
| 2024 | $5,134 | $446,800 | $104,300 | $342,500 |
| 2023 | $4,504 | $367,100 | $86,100 | $281,000 |
| 2022 | $4,027 | $319,100 | $82,000 | $237,100 |
| 2021 | $3,825 | $276,600 | $78,000 | $198,600 |
| 2020 | $3,467 | $239,900 | $76,900 | $163,000 |
| 2019 | $2,992 | $205,200 | $74,100 | $131,100 |
| 2018 | $2,902 | $198,500 | $80,200 | $118,300 |
| 2017 | $2,727 | $194,800 | $76,500 | $118,300 |
| 2016 | $2,685 | $197,000 | $81,400 | $115,600 |
| 2015 | $2,577 | $197,000 | $81,400 | $115,600 |
| 2014 | $2,578 | $204,900 | $79,000 | $125,900 |
Source: Public Records
Map
Nearby Homes
- 529 Osborn St
- 549 Osborn St
- 559 Osborn St
- 34 Manton St
- 24 Manton St
- 46 Manton St
- 563 Osborn St
- 563 Osborn St Unit 1
- 534 Osborn St
- 454 Whipple St
- 454 Whipple St Unit 1
- 454 Whipple St Unit 2
- 552 Osborn St
- 528 Osborn St
- 58 Manton St
- 573 Osborn St
- 556-560 Oborn St
- 556 Osborn St
- 424 Whipple St
- 566 Osborn St
Your Personal Tour Guide
Ask me questions while you tour the home.