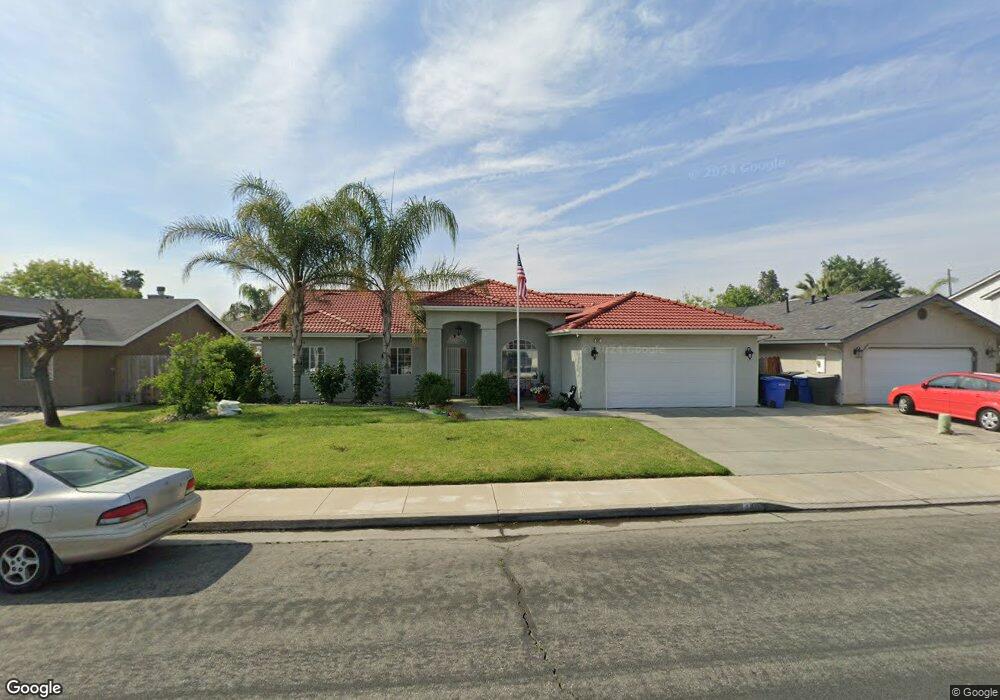
541 W Windsor Dr Hanford, CA 93230
Estimated Value: $415,704 - $446,000
4
Beds
2
Baths
1,842
Sq Ft
$233/Sq Ft
Est. Value
About This Home
This home is located at 541 W Windsor Dr, Hanford, CA 93230 and is currently estimated at $428,426, approximately $232 per square foot. 541 W Windsor Dr is a home located in Kings County with nearby schools including Hanford West High School, Pioneer Elementary School, and Pioneer Middle School.
Ownership History
Date
Name
Owned For
Owner Type
Purchase Details
Closed on
Jan 29, 2007
Sold by
Maman Jasvir
Bought by
Kaur Maman Jasvir Singh and Kaur Maman Narinder
Current Estimated Value
Home Financials for this Owner
Home Financials are based on the most recent Mortgage that was taken out on this home.
Original Mortgage
$212,000
Outstanding Balance
$125,693
Interest Rate
6.16%
Mortgage Type
Purchase Money Mortgage
Estimated Equity
$302,733
Purchase Details
Closed on
Dec 28, 2006
Sold by
Maman Narinder
Bought by
Maman Jasvir
Home Financials for this Owner
Home Financials are based on the most recent Mortgage that was taken out on this home.
Original Mortgage
$212,000
Outstanding Balance
$125,693
Interest Rate
6.16%
Mortgage Type
Purchase Money Mortgage
Estimated Equity
$302,733
Purchase Details
Closed on
Dec 20, 2006
Sold by
Hendrickson Justin and Hendrickson Maria
Bought by
Maman Jasvir
Home Financials for this Owner
Home Financials are based on the most recent Mortgage that was taken out on this home.
Original Mortgage
$212,000
Outstanding Balance
$125,693
Interest Rate
6.16%
Mortgage Type
Purchase Money Mortgage
Estimated Equity
$302,733
Purchase Details
Closed on
Aug 15, 2003
Sold by
Johnson Hiram S and Johnson Christina M
Bought by
Hendrickson Justin and Hendrickson Maria
Home Financials for this Owner
Home Financials are based on the most recent Mortgage that was taken out on this home.
Original Mortgage
$195,700
Interest Rate
6.4%
Mortgage Type
VA
Purchase Details
Closed on
Oct 27, 2000
Sold by
Fremont Investment & Loan
Bought by
Johnson Hiram S and Johnson Christina M
Home Financials for this Owner
Home Financials are based on the most recent Mortgage that was taken out on this home.
Original Mortgage
$145,750
Interest Rate
7.86%
Mortgage Type
VA
Purchase Details
Closed on
Jul 26, 2000
Sold by
Vryhof John L
Bought by
Fremont Investment & Loan
Purchase Details
Closed on
Sep 16, 1998
Sold by
Vryhof Robin L
Bought by
Vryhof John L
Home Financials for this Owner
Home Financials are based on the most recent Mortgage that was taken out on this home.
Original Mortgage
$144,000
Interest Rate
8.75%
Purchase Details
Closed on
Sep 22, 1997
Sold by
Quail Run Hanford Lp
Bought by
Excel Construction & Development Inc
Home Financials for this Owner
Home Financials are based on the most recent Mortgage that was taken out on this home.
Original Mortgage
$77,000
Interest Rate
7.49%
Create a Home Valuation Report for This Property
The Home Valuation Report is an in-depth analysis detailing your home's value as well as a comparison with similar homes in the area
Home Values in the Area
Average Home Value in this Area
Purchase History
| Date | Buyer | Sale Price | Title Company |
|---|---|---|---|
| Kaur Maman Jasvir Singh | -- | None Available | |
| Maman Jasvir | -- | Chicago Title Co | |
| Maman Jasvir | $265,000 | Chicago Title Co | |
| Hendrickson Justin | $197,000 | Chicago Title Company | |
| Johnson Hiram S | $143,000 | First American Title Co | |
| Fremont Investment & Loan | $153,113 | First American Title Co | |
| Vryhof John L | -- | Hanford Title Co | |
| Vryhof John L | $180,000 | Hanford Title Co | |
| Excel Construction & Development Inc | $30,000 | Hanford Title Co |
Source: Public Records
Mortgage History
| Date | Status | Borrower | Loan Amount |
|---|---|---|---|
| Open | Maman Jasvir | $212,000 | |
| Previous Owner | Hendrickson Justin | $195,700 | |
| Previous Owner | Johnson Hiram S | $145,750 | |
| Previous Owner | Vryhof John L | $144,000 | |
| Previous Owner | Excel Construction & Development Inc | $77,000 | |
| Closed | Vryhof John L | $27,000 |
Source: Public Records
Tax History
| Year | Tax Paid | Tax Assessment Tax Assessment Total Assessment is a certain percentage of the fair market value that is determined by local assessors to be the total taxable value of land and additions on the property. | Land | Improvement |
|---|---|---|---|---|
| 2025 | $3,802 | $355,040 | $120,578 | $234,462 |
| 2023 | $3,802 | $341,255 | $115,897 | $225,358 |
| 2022 | $3,682 | $334,565 | $113,625 | $220,940 |
| 2021 | $3,416 | $310,000 | $80,000 | $230,000 |
| 2020 | $3,123 | $280,000 | $76,500 | $203,500 |
| 2019 | $2,910 | $260,000 | $75,000 | $185,000 |
| 2018 | $2,739 | $241,500 | $75,000 | $166,500 |
| 2017 | $2,613 | $230,000 | $75,000 | $155,000 |
| 2016 | $2,129 | $194,250 | $70,000 | $124,250 |
| 2015 | $1,995 | $185,000 | $60,000 | $125,000 |
| 2014 | $1,856 | $167,758 | $60,272 | $107,486 |
Source: Public Records
Map
Nearby Homes
- 3026 Sage Ct
- 2710 Aspen St
- 903 W Sandstone Ct Unit 1
- 3178 Hickory Ct
- 388 Timberline Ct
- 990 Northstar Dr
- 3232 N Zion Cir
- 3064 N Yale Way
- 3207 Juniper Ct
- 903 W Redwood St
- 3262 Morning Dove Ln
- 297 W Harold Griswold Way
- 259 E Sherwood Dr
- 906 Don Medico Dr
- 1128 W Orange St
- 230 W Ash Ave
- 921 Don Medico Dr
- 952 Upp Ct
- 1079 W Ambassador Dr
- 0 Flint Ave
- 551 W Windsor Dr
- 531 W Windsor Dr
- 540 Pepper Dr
- 550 Pepper Dr
- 530 Pepper Dr
- 561 W Windsor Dr
- 521 W Windsor Dr
- 560 W Pepper Dr
- 542 W Windsor Dr
- 552 W Windsor Dr
- 560 Pepper Dr
- 520 Pepper Dr
- 532 W Windsor Dr
- 562 W Windsor Dr
- 575 W Windsor Dr
- 511 W Windsor Dr Unit 2
- 570 Pepper Dr
- 510 Pepper Dr
- 572 W Windsor Dr
- 512 W Windsor Dr
Your Personal Tour Guide
Ask me questions while you tour the home.