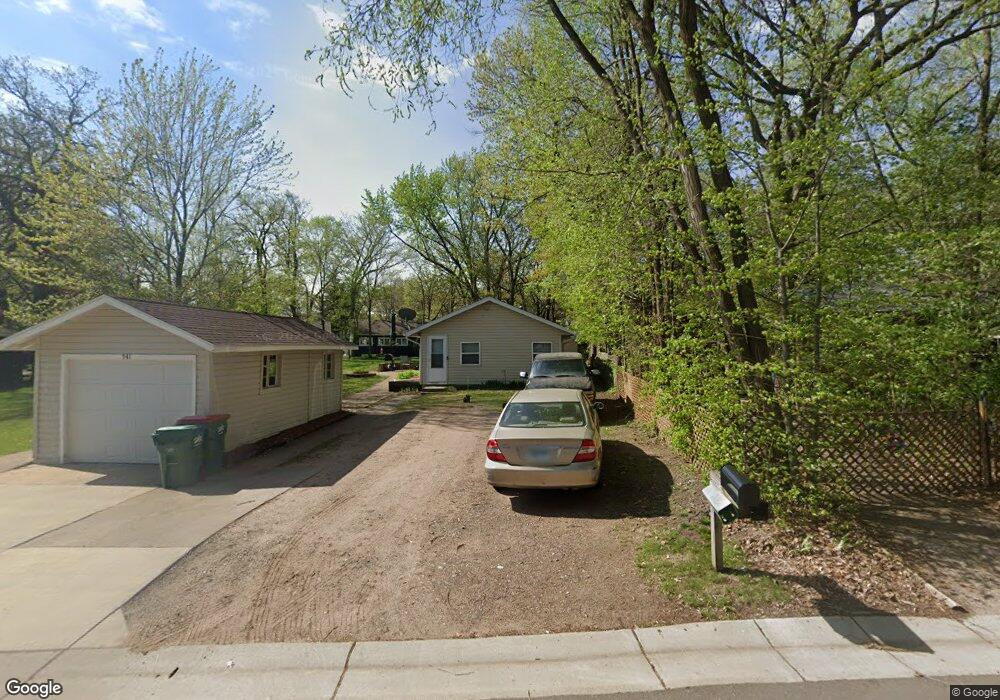
541 Westwood Dr Big Lake, MN 55309
Estimated Value: $220,000 - $286,000
2
Beds
1
Bath
928
Sq Ft
$265/Sq Ft
Est. Value
About This Home
This home is located at 541 Westwood Dr, Big Lake, MN 55309 and is currently estimated at $245,681, approximately $264 per square foot. 541 Westwood Dr is a home located in Sherburne County with nearby schools including Liberty Elementary School, Independence Elementary School, and Big Lake Middle School.
Ownership History
Date
Name
Owned For
Owner Type
Purchase Details
Closed on
Aug 20, 2021
Sold by
Ctw Group Inc
Bought by
Dobel Angela
Current Estimated Value
Home Financials for this Owner
Home Financials are based on the most recent Mortgage that was taken out on this home.
Original Mortgage
$180,000
Outstanding Balance
$163,180
Interest Rate
2.7%
Mortgage Type
New Conventional
Estimated Equity
$82,501
Purchase Details
Closed on
May 3, 2021
Sold by
Peterson Linda
Bought by
Ctw Group Inc
Purchase Details
Closed on
Mar 18, 2009
Sold by
Wells Fargo Bank Na
Bought by
Peterson Linda
Purchase Details
Closed on
Jan 5, 2009
Sold by
Wells Fargo Bank Na
Bought by
Peterson Linda
Purchase Details
Closed on
Apr 30, 2005
Sold by
Ohland Jonathan E
Bought by
Hagen Cory G
Purchase Details
Closed on
Jul 31, 2003
Sold by
Wendland Susan J
Bought by
Ohland Jonathan E
Create a Home Valuation Report for This Property
The Home Valuation Report is an in-depth analysis detailing your home's value as well as a comparison with similar homes in the area
Home Values in the Area
Average Home Value in this Area
Purchase History
| Date | Buyer | Sale Price | Title Company |
|---|---|---|---|
| Dobel Angela | $215,000 | Titlesmart Inc | |
| Ctw Group Inc | $100,000 | Titlesmart Inc | |
| Peterson Linda | $40,000 | -- | |
| Peterson Linda | $40,000 | -- | |
| Hagen Cory G | $140,000 | -- | |
| Ohland Jonathan E | $118,900 | -- | |
| -- | $100,000 | -- |
Source: Public Records
Mortgage History
| Date | Status | Borrower | Loan Amount |
|---|---|---|---|
| Open | Dobel Angela | $180,000 |
Source: Public Records
Tax History Compared to Growth
Tax History
| Year | Tax Paid | Tax Assessment Tax Assessment Total Assessment is a certain percentage of the fair market value that is determined by local assessors to be the total taxable value of land and additions on the property. | Land | Improvement |
|---|---|---|---|---|
| 2025 | $2,362 | $212,300 | $65,200 | $147,100 |
| 2024 | $2,508 | $212,300 | $65,200 | $147,100 |
| 2023 | $2,456 | $220,400 | $73,100 | $147,300 |
| 2022 | $1,856 | $209,500 | $62,100 | $147,400 |
| 2020 | $1,650 | $136,100 | $37,400 | $98,700 |
| 2019 | $1,366 | $126,800 | $34,500 | $92,300 |
| 2018 | $1,268 | $109,000 | $31,700 | $77,300 |
| 2017 | $1,182 | $100,200 | $29,000 | $71,200 |
| 2016 | $1,098 | $92,900 | $25,900 | $67,000 |
| 2015 | $988 | $59,600 | $17,000 | $42,600 |
| 2014 | $888 | $57,300 | $16,800 | $40,500 |
| 2013 | -- | $48,900 | $15,600 | $33,300 |
Source: Public Records
Map
Nearby Homes
- 679 Lakeshore Dr
- 491 Highland Ave
- 241 Leighton Dr
- TBD Highway 10 NW
- TBD Manitou St
- 3300 Lake View Ln
- 20311 Gordon Ln
- 20050 County Road 81 NW
- 240 Wyoming Ave
- 100 Park Ave
- 4637 Pond View Cir
- 5008 Bluff Rd
- 3250 Lake Ridge Dr
- 4265 Lake Ridge Dr
- 20172 Truman Dr
- 20189 Esther Pkwy
- 110 Powell Cir E
- 637 Norwood Ln
- 1075 Kilbirnie Rd
- 18585 Arctic Ave
- 521 Westwood Dr
- 511 Westwood Dr
- 561 Westwood Dr
- 460 Highland Ave
- 430 Highland Ave
- 520 Westwood Dr
- 450 Highland Ave
- 530 Westwood Dr
- 571 Westwood Dr
- 560 Westwood Dr
- 510 Westwood Dr
- 591 Lakeshore Dr
- 565 Westwood Dr
- 470 Highland Ave
- 470 Highland Ave
- 531 Lakeshore Dr
- 501 Lakeshore Dr
- 601 Lakeshore Dr
- 581 Westwood Dr
- 639 Red Oak Dr