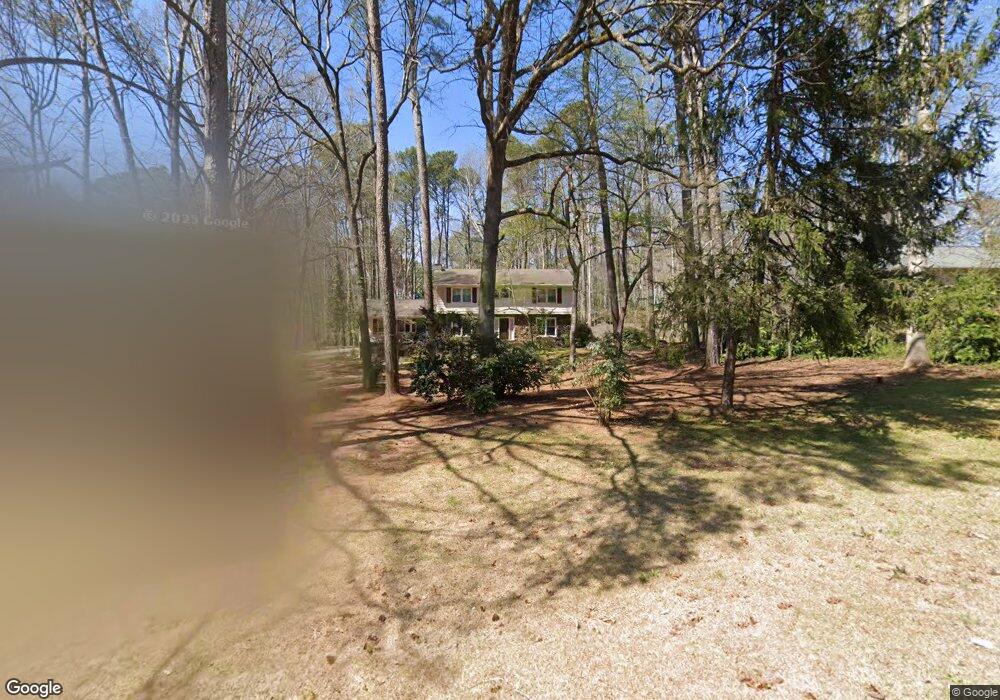
5410 Rosser Rd Unit 16 Stone Mountain, GA 30087
Estimated Value: $543,000 - $567,460
6
Beds
5
Baths
3,818
Sq Ft
$146/Sq Ft
Est. Value
About This Home
This home is located at 5410 Rosser Rd Unit 16, Stone Mountain, GA 30087 and is currently estimated at $557,365, approximately $145 per square foot. 5410 Rosser Rd Unit 16 is a home located in DeKalb County with nearby schools including Smoke Rise Elementary School, Tucker Middle School, and Tucker High School.
Ownership History
Date
Name
Owned For
Owner Type
Purchase Details
Closed on
Mar 13, 2017
Sold by
Hankin David
Bought by
Graves Charles R and Graves Darla J
Current Estimated Value
Home Financials for this Owner
Home Financials are based on the most recent Mortgage that was taken out on this home.
Original Mortgage
$227,600
Outstanding Balance
$188,285
Interest Rate
4.17%
Mortgage Type
New Conventional
Estimated Equity
$369,080
Purchase Details
Closed on
May 31, 2013
Sold by
Bales Mike
Bought by
Hankin David and Hankin Meagan Massa
Home Financials for this Owner
Home Financials are based on the most recent Mortgage that was taken out on this home.
Original Mortgage
$188,000
Interest Rate
3.37%
Mortgage Type
New Conventional
Purchase Details
Closed on
Dec 20, 2012
Sold by
Oliver Richard Holt
Bought by
Bales Mike
Purchase Details
Closed on
Mar 26, 2007
Sold by
Oliver Adelyn R
Bought by
Oliver Richard H
Purchase Details
Closed on
Nov 8, 1995
Sold by
Winn Kevin J Carolyn
Bought by
Oliver Richard H Ade
Create a Home Valuation Report for This Property
The Home Valuation Report is an in-depth analysis detailing your home's value as well as a comparison with similar homes in the area
Home Values in the Area
Average Home Value in this Area
Purchase History
| Date | Buyer | Sale Price | Title Company |
|---|---|---|---|
| Graves Charles R | $284,500 | -- | |
| Hankin David | $235,000 | -- | |
| Bales Mike | $155,000 | -- | |
| Oliver Richard H | -- | -- | |
| Oliver Richard H Ade | $182,000 | -- |
Source: Public Records
Mortgage History
| Date | Status | Borrower | Loan Amount |
|---|---|---|---|
| Open | Graves Charles R | $227,600 | |
| Previous Owner | Hankin David | $188,000 | |
| Closed | Oliver Richard H Ade | $0 |
Source: Public Records
Tax History Compared to Growth
Tax History
| Year | Tax Paid | Tax Assessment Tax Assessment Total Assessment is a certain percentage of the fair market value that is determined by local assessors to be the total taxable value of land and additions on the property. | Land | Improvement |
|---|---|---|---|---|
| 2025 | $6,823 | $242,800 | $38,600 | $204,200 |
| 2024 | $5,461 | $177,600 | $24,864 | $152,736 |
| 2023 | $5,461 | $177,600 | $24,864 | $152,736 |
| 2022 | $5,330 | $177,600 | $24,000 | $153,600 |
| 2021 | $5,154 | $167,000 | $24,000 | $143,000 |
| 2020 | $4,734 | $151,040 | $50,040 | $101,000 |
| 2019 | $4,379 | $162,080 | $50,040 | $112,040 |
| 2018 | $3,524 | $113,800 | $41,840 | $71,960 |
| 2017 | $3,390 | $114,600 | $50,040 | $64,560 |
| 2016 | $3,380 | $116,200 | $50,040 | $66,160 |
| 2014 | $2,824 | $92,080 | $50,040 | $42,040 |
Source: Public Records
Map
Nearby Homes
- 5363 Rosser Rd
- 5401 Smoke Rise Dr
- 2350 Oxbow Cir
- 5211 Hugh Howell Rd
- 5169 Oxbow Rd
- 127 Roe Hampton Ln
- 2174 Deer Ridge Dr
- 353 Old Rosser Rd
- 2037 Stoneleigh Dr
- 5523 Bahia Mar Cir
- 2023 Stoneleigh Dr
- 507 Castleaire Dr Unit 1
- 507 Castlearie Dr
- 5632 Stillwater Ct
- 292 Old Rosser Rd
- 483 Rollingwood Dr
- 4999 Antebellum Dr
- 4956 Mountclaire Rd
- 5422 Rosser Rd
- 5398 Rosser Rd Unit 218
- 5398 Rosser Rd
- 5384 Rosser Rd
- 353 Rosser Rd
- 0 Rosser Rd Unit 8530823
- 0 Rosser Rd Unit 8475344
- 0 Rosser Rd Unit 8113920
- 0 Rosser Rd Unit 8019471
- 0 Rosser Rd Unit 8239231
- 0 Rosser Rd Unit 7562151
- 0 Rosser Rd Unit 3178288
- 0 Rosser Rd Unit 3181964
- 0 Rosser Rd Unit 7080001
- 0 Rosser Rd Unit 7152972
- 0 Rosser Rd Unit 7268284
- 0 Rosser Rd Unit 7449196
- 0 Rosser Rd
- 5436 Rosser Rd
- 5427 Oxbow Rd