Estimated Value: $260,000 - $338,000
2
Beds
1
Bath
978
Sq Ft
$303/Sq Ft
Est. Value
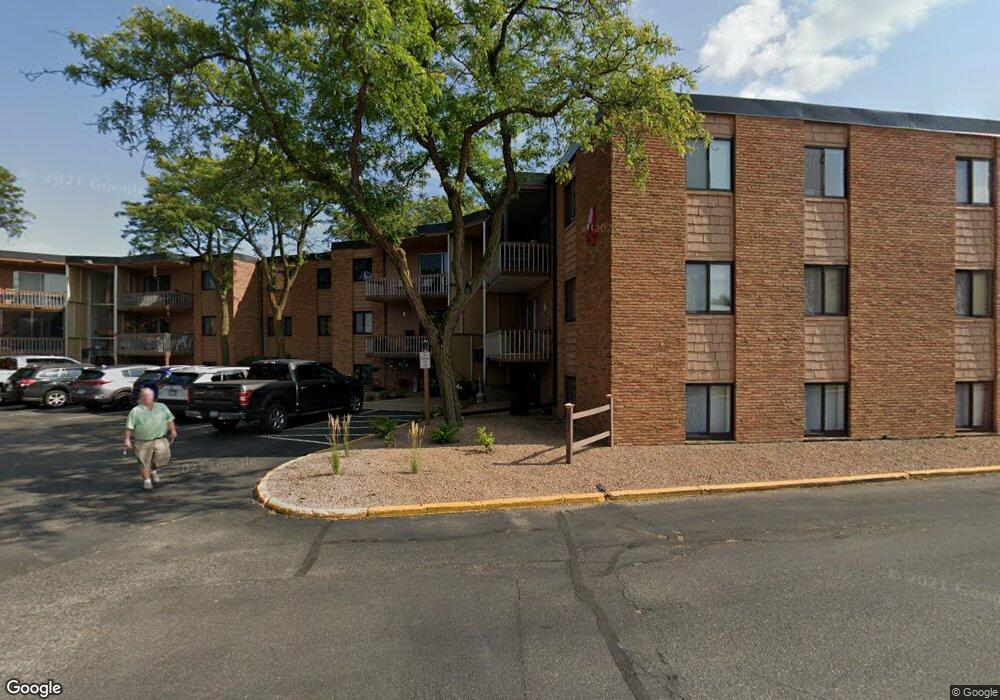
About This Home
This home is located at 5410 Three Points Blvd Unit 433, Mound, MN 55364 and is currently estimated at $296,560, approximately $303 per square foot. 5410 Three Points Blvd Unit 433 is a home located in Hennepin County with nearby schools including Hilltop Primary School, Westonka Middle School, and Westonka High School.
Ownership History
Date
Name
Owned For
Owner Type
Purchase Details
Closed on
May 9, 2025
Sold by
Moser Harvey J and Moser Allison P
Bought by
Montgomery Carl and Montgomery Lauren
Current Estimated Value
Home Financials for this Owner
Home Financials are based on the most recent Mortgage that was taken out on this home.
Original Mortgage
$150,000
Outstanding Balance
$149,468
Interest Rate
6.64%
Mortgage Type
New Conventional
Estimated Equity
$147,092
Purchase Details
Closed on
Jan 25, 2016
Sold by
Sunberg Malcolm C
Bought by
Moser Harvey and Moser Allison
Purchase Details
Closed on
Mar 31, 2005
Sold by
The Russell Family Trust
Bought by
Sunberg Malcolm C
Create a Home Valuation Report for This Property
The Home Valuation Report is an in-depth analysis detailing your home's value as well as a comparison with similar homes in the area
Home Values in the Area
Average Home Value in this Area
Purchase History
| Date | Buyer | Sale Price | Title Company |
|---|---|---|---|
| Montgomery Carl | $300,000 | Watermark Title | |
| Moser Harvey | $144,900 | Burnet Title | |
| Sunberg Malcolm C | $167,500 | -- |
Source: Public Records
Mortgage History
| Date | Status | Borrower | Loan Amount |
|---|---|---|---|
| Open | Montgomery Carl | $150,000 |
Source: Public Records
Tax History
| Year | Tax Paid | Tax Assessment Tax Assessment Total Assessment is a certain percentage of the fair market value that is determined by local assessors to be the total taxable value of land and additions on the property. | Land | Improvement |
|---|---|---|---|---|
| 2024 | $2,489 | $226,700 | $47,000 | $179,700 |
| 2023 | $2,451 | $235,100 | $52,500 | $182,600 |
| 2022 | $2,183 | $213,000 | $39,000 | $174,000 |
| 2021 | $2,203 | $186,000 | $33,000 | $153,000 |
| 2020 | $1,988 | $187,000 | $30,000 | $157,000 |
| 2019 | $2,282 | $157,000 | $20,000 | $137,000 |
| 2018 | $1,857 | $178,000 | $29,000 | $149,000 |
| 2017 | $1,218 | $112,000 | $18,000 | $94,000 |
| 2016 | $1,394 | $108,000 | $18,000 | $90,000 |
| 2015 | $1,602 | $133,000 | $20,000 | $113,000 |
| 2014 | -- | $111,000 | $16,000 | $95,000 |
Source: Public Records
Map
Nearby Homes
- 5420 Three Points Blvd Unit 232
- 5430 Three Points Blvd Unit 131
- 5430 Three Points Blvd Unit 123
- 5440 Three Points Blvd Unit 513
- 5440 Three Points Blvd Unit 525
- 5440 Three Points Blvd Unit 536
- 5450 Three Points Blvd Unit 623
- 5335 Baywood Shores Dr
- 1800 Commerce Blvd
- 1571 Bluebird Ln
- 5118 Three Points Blvd
- 2108 Belmont Ln
- 2135 Cedar Ln
- 2128 Cedar Ln
- 5749 Grandview Blvd
- 2134 Basswood Ln
- 5773 Grandview Blvd
- 4945 Glen Elyn Rd
- 5760 Village Trail
- 5735 Village Trail Unit 5735
- 5400 Three Points Blvd Unit 316
- 5400 Three Points Blvd Unit 315
- 5410 Three Points Blvd Unit 432
- 5410 Three Points Blvd Unit 431
- 5410 Three Points Blvd Unit 423
- 5410 Three Points Blvd Unit 422
- 5410 Three Points Blvd Unit 414
- 5400 Three Points Blvd Unit 335
- 5400 Three Points Blvd Unit 334
- 5400 Three Points Blvd Unit 333
- 5400 Three Points Blvd Unit 331
- 5400 Three Points Blvd Unit 326
- 5400 Three Points Blvd Unit 324
- 5400 Three Points Blvd Unit 323
- 5400 Three Points Blvd Unit 322
- 5400 Three Points Blvd Unit 314
- 5400 Three Points Blvd Unit 311
- 5410 Three Points Blvd Unit 424
- 5400 Three Points Blvd Unit 316
- 5400 Three Points Blvd
Your Personal Tour Guide
Ask me questions while you tour the home.