5412 60th St Sacramento, CA 95820
Tallac Village NeighborhoodEstimated Value: $326,371 - $378,000
3
Beds
1
Bath
1,039
Sq Ft
$336/Sq Ft
Est. Value
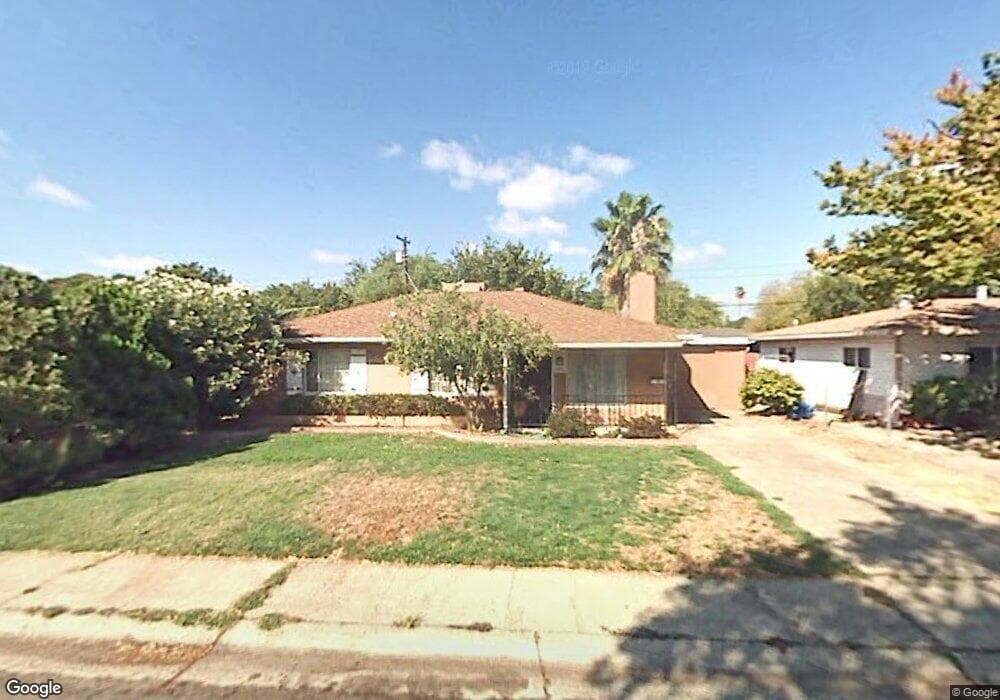
About This Home
This home is located at 5412 60th St, Sacramento, CA 95820 and is currently estimated at $349,593, approximately $336 per square foot. 5412 60th St is a home located in Sacramento County with nearby schools including Mark Twain Elementary School, Umoja International Academy, and Hiram W. Johnson High School.
Ownership History
Date
Name
Owned For
Owner Type
Purchase Details
Closed on
Apr 21, 2011
Sold by
Bank Of America National Association
Bought by
Oriciaga Nestor Mar
Current Estimated Value
Purchase Details
Closed on
Mar 18, 2011
Sold by
Yang Shoua
Bought by
Bank Of America National Association
Purchase Details
Closed on
Sep 3, 2004
Sold by
Adams Therese A
Bought by
Yang Shoua
Home Financials for this Owner
Home Financials are based on the most recent Mortgage that was taken out on this home.
Original Mortgage
$186,400
Interest Rate
5.99%
Mortgage Type
Purchase Money Mortgage
Purchase Details
Closed on
Mar 30, 2004
Sold by
Moulter Richard H
Bought by
Moulter Richard H and Adams Therese A
Purchase Details
Closed on
Dec 3, 2003
Sold by
Moulter Richard H and Moulter Beulah M
Bought by
Moulter Richard H
Create a Home Valuation Report for This Property
The Home Valuation Report is an in-depth analysis detailing your home's value as well as a comparison with similar homes in the area
Home Values in the Area
Average Home Value in this Area
Purchase History
| Date | Buyer | Sale Price | Title Company |
|---|---|---|---|
| Oriciaga Nestor Mar | $63,500 | Ticor Title Company Of Ca | |
| Bank Of America National Association | $66,871 | None Available | |
| Yang Shoua | $233,000 | North American Title Co | |
| Moulter Richard H | -- | -- | |
| Moulter Richard H | -- | -- |
Source: Public Records
Mortgage History
| Date | Status | Borrower | Loan Amount |
|---|---|---|---|
| Previous Owner | Yang Shoua | $186,400 | |
| Closed | Yang Shoua | $46,600 |
Source: Public Records
Tax History Compared to Growth
Tax History
| Year | Tax Paid | Tax Assessment Tax Assessment Total Assessment is a certain percentage of the fair market value that is determined by local assessors to be the total taxable value of land and additions on the property. | Land | Improvement |
|---|---|---|---|---|
| 2025 | $1,109 | $81,339 | $44,833 | $36,506 |
| 2024 | $1,109 | $79,745 | $43,954 | $35,791 |
| 2023 | $1,083 | $78,183 | $43,093 | $35,090 |
| 2022 | $1,063 | $76,651 | $42,249 | $34,402 |
| 2021 | $1,015 | $75,149 | $41,421 | $33,728 |
| 2020 | $1,019 | $74,380 | $40,997 | $33,383 |
| 2019 | $999 | $72,923 | $40,194 | $32,729 |
| 2018 | $973 | $71,494 | $39,406 | $32,088 |
| 2017 | $958 | $70,093 | $38,634 | $31,459 |
| 2016 | $911 | $68,720 | $37,877 | $30,843 |
| 2015 | $896 | $67,689 | $37,309 | $30,380 |
| 2014 | $875 | $66,364 | $36,579 | $29,785 |
Source: Public Records
Map
Nearby Homes