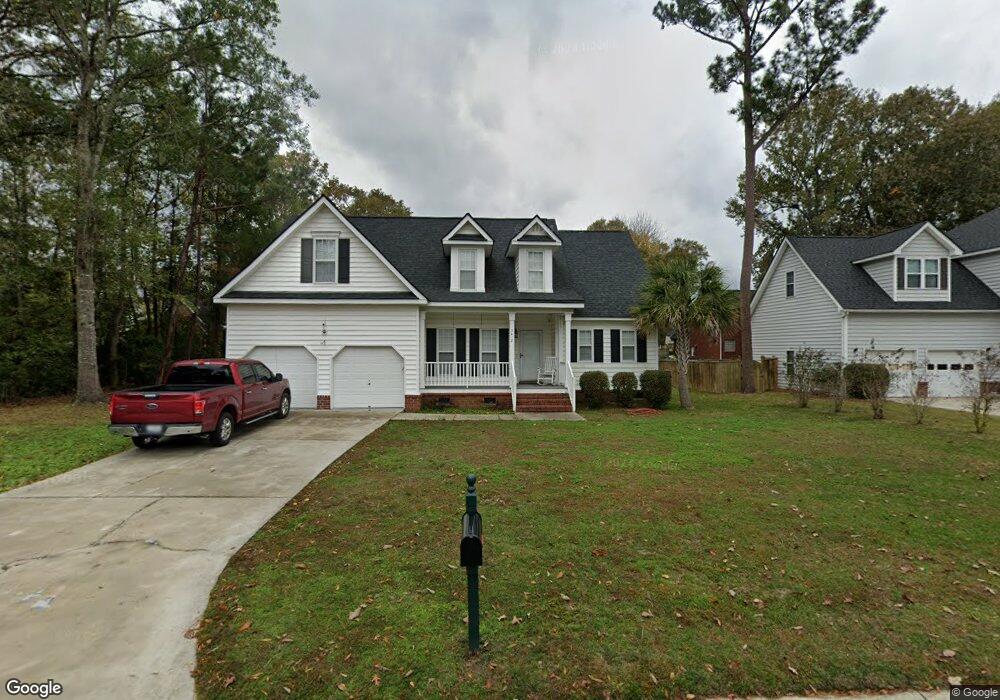
5412 Indigo Fields Blvd North Charleston, SC 29418
Estimated Value: $369,000 - $408,000
4
Beds
3
Baths
1,889
Sq Ft
$207/Sq Ft
Est. Value
About This Home
This home is located at 5412 Indigo Fields Blvd, North Charleston, SC 29418 and is currently estimated at $390,997, approximately $206 per square foot. 5412 Indigo Fields Blvd is a home located in Dorchester County with nearby schools including Eagle Nest Elementary School, River Oaks Middle School, and Fort Dorchester High School.
Ownership History
Date
Name
Owned For
Owner Type
Purchase Details
Closed on
Aug 9, 2013
Sold by
Hall Vivian
Bought by
Mayczk William G
Current Estimated Value
Home Financials for this Owner
Home Financials are based on the most recent Mortgage that was taken out on this home.
Original Mortgage
$178,000
Outstanding Balance
$131,434
Interest Rate
4.29%
Mortgage Type
New Conventional
Estimated Equity
$259,563
Purchase Details
Closed on
Oct 30, 2006
Sold by
Gillespie Glenda Hall
Bought by
Hall Vivian A
Purchase Details
Closed on
Aug 25, 2006
Sold by
Hall Wilson Latonja P
Bought by
Hall Vivian A
Purchase Details
Closed on
Aug 24, 2006
Sold by
Lorick Natashia Hall
Bought by
Hall Vivian A
Purchase Details
Closed on
Aug 2, 2006
Sold by
Hall Vivian A
Bought by
Hall Vivian A and Hall Wilson Latonja P
Purchase Details
Closed on
Nov 4, 1999
Sold by
R D Morris & Associates Ll
Bought by
Hall Virginia A
Create a Home Valuation Report for This Property
The Home Valuation Report is an in-depth analysis detailing your home's value as well as a comparison with similar homes in the area
Home Values in the Area
Average Home Value in this Area
Purchase History
| Date | Buyer | Sale Price | Title Company |
|---|---|---|---|
| Mayczk William G | $178,000 | -- | |
| Hall Vivian A | -- | None Available | |
| Hall Vivian A | -- | None Available | |
| Hall Vivian A | -- | None Available | |
| Hall Vivian A | -- | None Available | |
| Hall Virginia A | $141,425 | -- |
Source: Public Records
Mortgage History
| Date | Status | Borrower | Loan Amount |
|---|---|---|---|
| Open | Mayczk William G | $178,000 |
Source: Public Records
Tax History Compared to Growth
Tax History
| Year | Tax Paid | Tax Assessment Tax Assessment Total Assessment is a certain percentage of the fair market value that is determined by local assessors to be the total taxable value of land and additions on the property. | Land | Improvement |
|---|---|---|---|---|
| 2024 | $2,449 | $13,494 | $5,000 | $8,494 |
| 2023 | $2,449 | $8,411 | $2,600 | $5,811 |
| 2022 | $2,180 | $8,010 | $2,300 | $5,710 |
| 2021 | $2,095 | $8,010 | $2,300 | $5,710 |
| 2020 | $2,012 | $6,970 | $2,000 | $4,970 |
| 2019 | $1,984 | $6,970 | $2,000 | $4,970 |
| 2018 | $1,761 | $6,970 | $2,000 | $4,970 |
| 2017 | $1,703 | $6,970 | $2,000 | $4,970 |
| 2016 | $1,703 | $6,970 | $2,000 | $4,970 |
| 2015 | $1,699 | $6,970 | $2,000 | $4,970 |
| 2014 | -- | $174,204 | $0 | $0 |
Source: Public Records
Map
Nearby Homes
- 8157 Governors Walk
- 5509 Lindo Terrace
- 5318 Natures Color Ln
- 110 Marsh Hall Dr
- 8316 Dye Makers
- 8301 Wild Indigo Bluff
- 5540 Indigo Fields Blvd
- 5417 Ansley Trail
- 104 Excaliber Place
- 3239 Landing Pkwy
- 116 Excaliber Place
- 5437 River Island Ct
- 136 Old Saybrook Rd
- 8250 Longridge Rd
- 5343 Tidewater Dr
- 112 Mansfield Blvd
- 128 Mansfield Blvd
- 4723 Cotillion Dr
- 113 Broadmarsh Ct
- 5545 Colonial Chatsworth Cir Unit 115F
- 5408 Indigo Fields Blvd
- 5479 King Indigo Ct
- 5483 King Indigo Ct
- 5475 King Indigo Ct
- 5404 Indigo Fields Blvd
- 5420 Indigo Fields Blvd
- 5409 Indigo Fields Blvd
- 5413 Indigo Fields Blvd
- 5405 Indigo Fields Blvd
- 5487 King Indigo Ct
- 5417 Indigo Fields Blvd
- 5401 Indigo Fields Blvd
- 5471 King Indigo Ct
- 5424 Indigo Fields Blvd
- 5400 Indigo Fields Blvd
- 5482 King Indigo Ct
- 5421 Indigo Fields Blvd
- 5504 Copper Trace
- 5478 King Indigo Ct
- 5508 Copper Trace