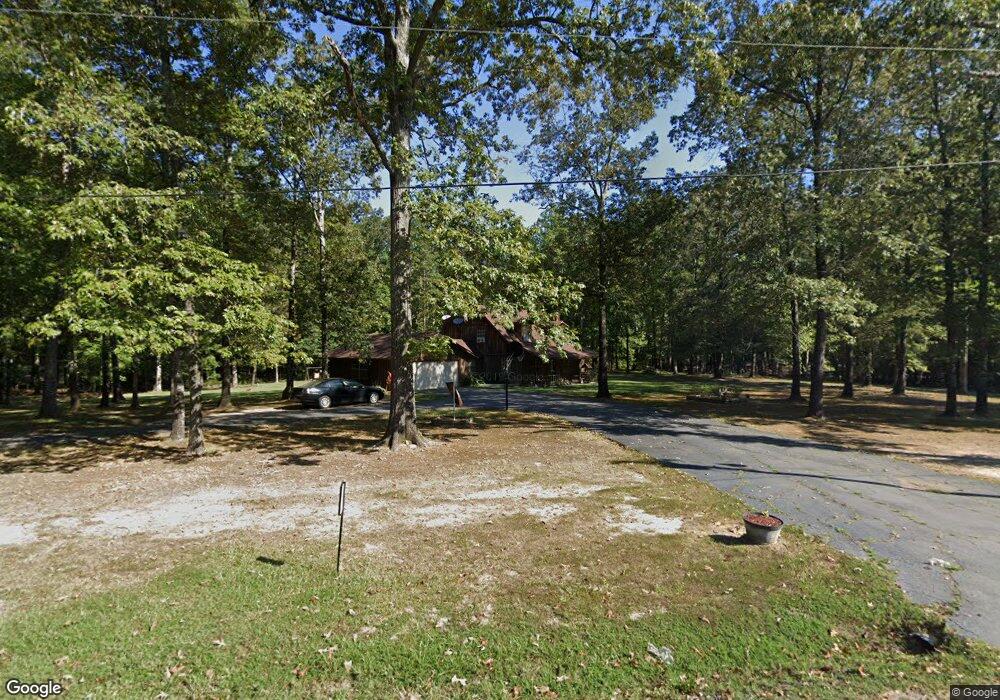
5412 Rogers Rd Pine Bluff, AR 71603
Estimated Value: $159,000 - $235,000
Studio
2
Baths
1,979
Sq Ft
$99/Sq Ft
Est. Value
About This Home
This home is located at 5412 Rogers Rd, Pine Bluff, AR 71603 and is currently estimated at $195,252, approximately $98 per square foot. 5412 Rogers Rd is a home located in Jefferson County with nearby schools including L.L. Owen Elementary School, Edgewood Elementary School, and Coleman Elementary School.
Ownership History
Date
Name
Owned For
Owner Type
Purchase Details
Closed on
Jun 23, 2010
Sold by
Secretary Of Housing And Urban Developme
Bought by
Gartner Todd
Current Estimated Value
Home Financials for this Owner
Home Financials are based on the most recent Mortgage that was taken out on this home.
Original Mortgage
$112,028
Outstanding Balance
$74,341
Interest Rate
4.77%
Estimated Equity
$120,911
Purchase Details
Closed on
Jan 6, 2010
Sold by
Cleveland Gregory M and Cleveland Deana Marie
Bought by
Wells Fargo Bank Na
Purchase Details
Closed on
Jul 28, 2009
Sold by
Wells Fargo Bank Na
Bought by
The Secretary Of Housing And Urban Devel
Purchase Details
Closed on
Jul 22, 1999
Bought by
Cleveland Gregory M
Purchase Details
Closed on
Mar 11, 1997
Bought by
Archer Thomas L and Archer Wf
Purchase Details
Closed on
Dec 14, 1994
Bought by
Selman Paul Andrew and Selman Wf
Purchase Details
Closed on
Jan 1, 1910
Bought by
Selman George E and Selman Wf
Create a Home Valuation Report for This Property
The Home Valuation Report is an in-depth analysis detailing your home's value as well as a comparison with similar homes in the area
Purchase History
| Date | Buyer | Sale Price | Title Company |
|---|---|---|---|
| Gartner Todd | -- | Professional Land Title Comp | |
| Wells Fargo Bank Na | $94,293 | -- | |
| The Secretary Of Housing And Urban Devel | -- | -- | |
| Cleveland Gregory M | $85,000 | -- | |
| Archer Thomas L | $74,000 | -- | |
| Selman Paul Andrew | $8,000 | -- | |
| Selman George E | -- | -- |
Source: Public Records
Mortgage History
| Date | Status | Borrower | Loan Amount |
|---|---|---|---|
| Open | Gartner Todd | $112,028 |
Source: Public Records
Tax History
| Year | Tax Paid | Tax Assessment Tax Assessment Total Assessment is a certain percentage of the fair market value that is determined by local assessors to be the total taxable value of land and additions on the property. | Land | Improvement |
|---|---|---|---|---|
| 2025 | $765 | $35,730 | $1,790 | $33,940 |
| 2024 | $805 | $35,730 | $1,790 | $33,940 |
| 2023 | $821 | $35,730 | $1,790 | $33,940 |
| 2022 | $812 | $24,000 | $1,340 | $22,660 |
| 2021 | $675 | $24,000 | $1,340 | $22,660 |
| 2020 | $654 | $24,000 | $1,340 | $22,660 |
| 2019 | $609 | $24,000 | $1,340 | $22,660 |
| 2018 | $589 | $24,000 | $1,340 | $22,660 |
| 2017 | $545 | $20,450 | $1,340 | $19,110 |
| 2016 | $545 | $20,450 | $1,340 | $19,110 |
| 2015 | $540 | $20,450 | $1,340 | $19,110 |
| 2014 | -- | $20,450 | $1,340 | $19,110 |
Source: Public Records
Map
Nearby Homes
- 5207 Straughn
- 8611 Sulphur Springs Rd
- 8424 Sulphur Springs Rd
- 000 Sulpher Springs Rd Unit LotWP001
- 8911 Pine Meadow Dr
- 8227 Sulphur Springs Rd
- 6740 Rayhan Rd
- 9210 Henderson Rd
- 5900 Ramick Rd
- 3703 Petty Rd
- 4802 Ramick Rd
- 4706 Ramick Rd
- 7214 Jericho Rd
- 7609 N Pinewood Dr
- 2907 Beechnut Dr
- 7507 S Pinewood Dr
- 8601 Dolphin Cove
- 0 Highway 79 S Unit 24032586
- 7908 and 7912 Sorrells Rd
- 6824 Nevins Rd
Your Personal Tour Guide
Ask me questions while you tour the home.