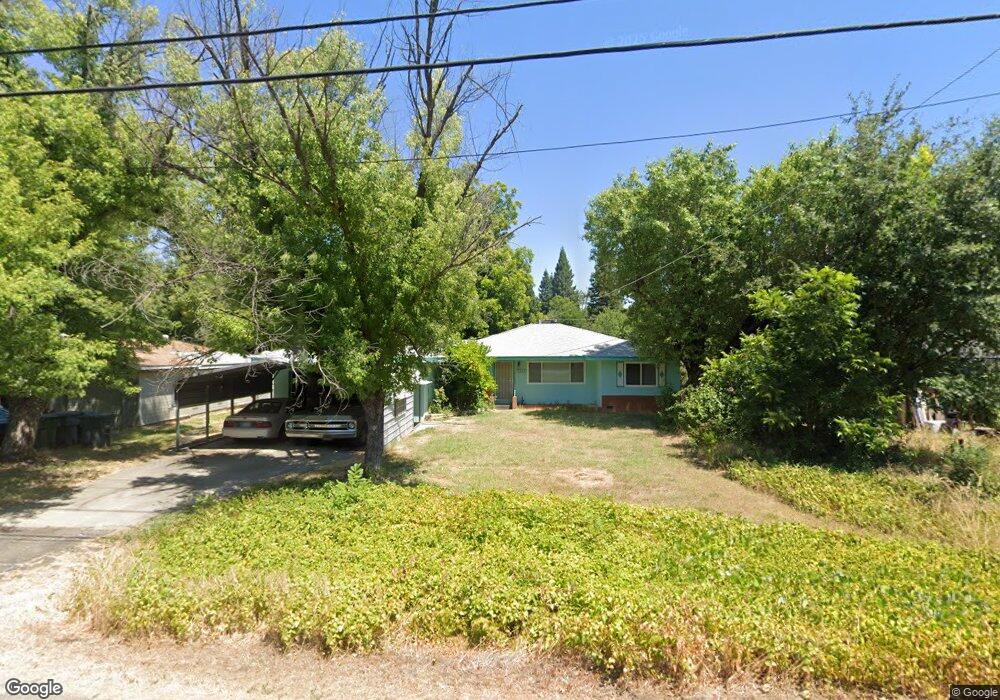
5413 E Bonnyview Rd Redding, CA 96001
Bonnyview NeighborhoodEstimated Value: $288,000 - $329,000
4
Beds
2
Baths
1,352
Sq Ft
$227/Sq Ft
Est. Value
About This Home
This home is located at 5413 E Bonnyview Rd, Redding, CA 96001 and is currently estimated at $307,190, approximately $227 per square foot. 5413 E Bonnyview Rd is a home located in Shasta County with nearby schools including Bonny View Elementary School, Sequoia Middle School, and Shasta High School.
Ownership History
Date
Name
Owned For
Owner Type
Purchase Details
Closed on
Feb 6, 2023
Sold by
Glenn L And Marie J Copher Family Trust
Bought by
Hoffman James D
Current Estimated Value
Create a Home Valuation Report for This Property
The Home Valuation Report is an in-depth analysis detailing your home's value as well as a comparison with similar homes in the area
Home Values in the Area
Average Home Value in this Area
Purchase History
| Date | Buyer | Sale Price | Title Company |
|---|---|---|---|
| Hoffman James D | -- | -- |
Source: Public Records
Tax History
| Year | Tax Paid | Tax Assessment Tax Assessment Total Assessment is a certain percentage of the fair market value that is determined by local assessors to be the total taxable value of land and additions on the property. | Land | Improvement |
|---|---|---|---|---|
| 2025 | $605 | $62,316 | $12,159 | $50,157 |
| 2024 | $594 | $61,095 | $11,921 | $49,174 |
| 2023 | $594 | $59,898 | $11,688 | $48,210 |
| 2022 | $582 | $58,724 | $11,459 | $47,265 |
| 2021 | $577 | $57,574 | $11,235 | $46,339 |
| 2020 | $659 | $56,984 | $11,120 | $45,864 |
| 2019 | $553 | $55,867 | $10,902 | $44,965 |
| 2018 | $555 | $54,773 | $10,689 | $44,084 |
| 2017 | $550 | $53,700 | $10,480 | $43,220 |
| 2016 | $532 | $52,648 | $10,275 | $42,373 |
| 2015 | $524 | $51,858 | $10,121 | $41,737 |
| 2014 | $519 | $50,843 | $9,923 | $40,920 |
Source: Public Records
Map
Nearby Homes
- 3232 Nicolet Ln
- 5855 Live Oak Ln
- 3500 Pioneer Ln
- 5367 Rosswood Ln
- 4920 Bonnyview Ave
- 2381 S Bonnyview Rd
- 2340 Wilsey Dr
- 3857 Eagle Pkwy
- 2521 Radio Ln
- 5812 Cedars Rd Unit 43
- 5812 Cedars Rd Unit 13
- 5812 Cedars Rd Unit 36
- 5812 Cedars Rd Unit 3
- 2200 Jewell Ln
- 0 Lot4 Unit 2 Ph 2 Stillwater Unit 25-4962
- 0 Lot3 Unit 2 Ph 2 Stillwater Unit 25-4961
- 0 Lot6 Unit 2 Ph 2 Stillwater Unit 25-4964
- 0 Lot5 Unit 2 Ph 2 Stillwater Unit 25-4963
- 0 Lot16 Unit 2 Ph 2 Stillwater Unit 25-4958
- 0 Lot9 Unit 2 Ph 2 Stillwater Unit 25-4967
- 5441 E Bonnyview Rd
- 5411 E Bonnyview Rd
- 5470 Willow Rd Unit ONE
- 5470 Willow Rd
- 5480 Willow Rd
- 5420 Willow Rd Unit 1
- 5420 Willow Rd
- 5449 Mill Pond Ln
- 3106 Willowbrae Ave
- 5465 E Bonnyview Rd
- 5437 Mill Pond Ln
- 5461 Mill Pond Ln
- 5375 E Bonnyview Rd
- 5500 Willow Rd
- 5473 Mill Pond Ln
- 5485 Mill Pond Ln
- 5425 Mill Pond Ln
- 5510 Willow Rd
- 5380 E Bonnyview Rd
- 5421 Willow Rd
Your Personal Tour Guide
Ask me questions while you tour the home.