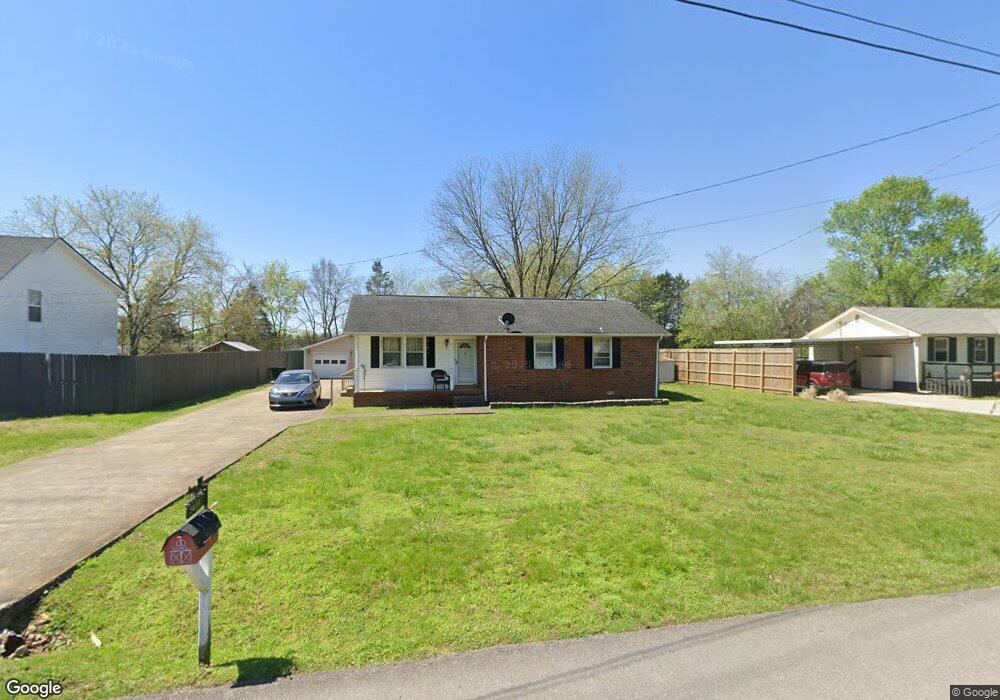
5413 Ellis Place Murfreesboro, TN 37129
Estimated Value: $286,220 - $345,000
--
Bed
2
Baths
1,262
Sq Ft
$247/Sq Ft
Est. Value
About This Home
This home is located at 5413 Ellis Place, Murfreesboro, TN 37129 and is currently estimated at $311,805, approximately $247 per square foot. 5413 Ellis Place is a home located in Rutherford County with nearby schools including Stewartsboro Elementary School, Smyrna Middle School, and Smyrna High School.
Ownership History
Date
Name
Owned For
Owner Type
Purchase Details
Closed on
Apr 28, 2011
Sold by
Burchett Larry
Bought by
Hall Johnny C
Current Estimated Value
Home Financials for this Owner
Home Financials are based on the most recent Mortgage that was taken out on this home.
Original Mortgage
$88,888
Outstanding Balance
$61,631
Interest Rate
4.83%
Mortgage Type
FHA
Estimated Equity
$250,174
Purchase Details
Closed on
Dec 5, 2005
Sold by
Leon Hogg
Bought by
Burchett and Karen
Home Financials for this Owner
Home Financials are based on the most recent Mortgage that was taken out on this home.
Original Mortgage
$89,150
Interest Rate
6.88%
Mortgage Type
Purchase Money Mortgage
Purchase Details
Closed on
Oct 20, 2004
Sold by
Burns Jackie B and Burns Donna D
Bought by
Leon Hogg
Purchase Details
Closed on
Jul 2, 1999
Sold by
Hardman Parley D
Bought by
Hardman Parley D
Purchase Details
Closed on
Dec 15, 1993
Sold by
Mark Morin Loren
Bought by
Drew Hardman Parley
Create a Home Valuation Report for This Property
The Home Valuation Report is an in-depth analysis detailing your home's value as well as a comparison with similar homes in the area
Home Values in the Area
Average Home Value in this Area
Purchase History
| Date | Buyer | Sale Price | Title Company |
|---|---|---|---|
| Hall Johnny C | $91,200 | -- | |
| Burchett | $118,900 | -- | |
| Leon Hogg | $79,100 | -- | |
| Hardman Parley D | -- | -- | |
| Drew Hardman Parley | $50,555 | -- |
Source: Public Records
Mortgage History
| Date | Status | Borrower | Loan Amount |
|---|---|---|---|
| Open | Hall Johnny C | $88,888 | |
| Previous Owner | Drew Hardman Parley | $89,150 | |
| Previous Owner | Drew Hardman Parley | $29,750 |
Source: Public Records
Tax History Compared to Growth
Tax History
| Year | Tax Paid | Tax Assessment Tax Assessment Total Assessment is a certain percentage of the fair market value that is determined by local assessors to be the total taxable value of land and additions on the property. | Land | Improvement |
|---|---|---|---|---|
| 2025 | $1,137 | $60,575 | $13,750 | $46,825 |
| 2024 | $1,137 | $60,575 | $13,750 | $46,825 |
| 2023 | $1,137 | $60,575 | $13,750 | $46,825 |
| 2022 | $979 | $60,575 | $13,750 | $46,825 |
| 2021 | $888 | $40,000 | $8,625 | $31,375 |
| 2020 | $888 | $40,000 | $8,625 | $31,375 |
| 2019 | $888 | $40,000 | $8,625 | $31,375 |
| 2018 | $840 | $40,000 | $0 | $0 |
| 2017 | $848 | $31,625 | $0 | $0 |
| 2016 | $848 | $31,625 | $0 | $0 |
| 2015 | $848 | $31,625 | $0 | $0 |
| 2014 | $786 | $31,625 | $0 | $0 |
| 2013 | -- | $31,175 | $0 | $0 |
Source: Public Records
Map
Nearby Homes
- 4529 Baywood Ave
- 5423 Colonial Cir
- 4436 Alpine Way
- 4408 Alpine Way
- 5311 Florence Rd
- 611 Cheyenne Ct
- 7523 Chapin Dr
- 6612 Scenic Dr
- 8607 Hooper St
- 5077 Florence Rd
- 9238 Burleson Ln
- 8815 West St
- 6903 Cooks Ave
- 6012 Westfork Dr
- 6904 Old Nashville Hwy
- 7709 Chapin Dr
- 7624 Chapin Dr
- 7705 Chapin Dr
- 7713 Chapin Dr
- 7632 Chapin Dr
- 5417 Ellis Place
- 5409 Ellis Place
- 5421 Ellis Place
- 5420 Ellis Place
- 5410 Ellis Place
- 5405 Ellis Place
- 5406 Ellis Place
- 5425 Ellis Place
- 5401 Ellis Place
- 4517 Baywood Ave
- 4513 Baywood Ave
- 4507 Baywood Ave
- 5413 Jernigan Ln Unit 5411
- 4525 Baywood Ave
- 5421 Jernigan Ln Unit 5423
- 336 Colonial Cir
- 4516 Baywood Ave
- 4520 Baywood Ave
- 4512 Baywood Ave
- 4524 Baywood Ave