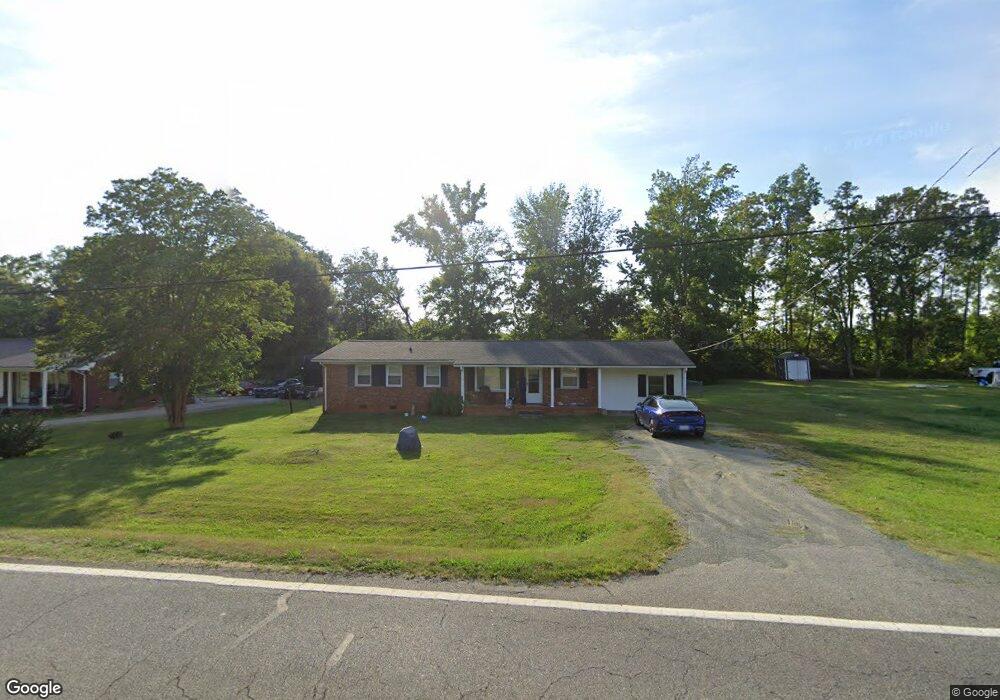
5413 S Nc Highway 49 Burlington, NC 27215
Estimated Value: $253,000 - $326,000
3
Beds
2
Baths
1,650
Sq Ft
$168/Sq Ft
Est. Value
About This Home
This home is located at 5413 S Nc Highway 49, Burlington, NC 27215 and is currently estimated at $276,661, approximately $167 per square foot. 5413 S Nc Highway 49 is a home located in Alamance County with nearby schools including Edwin M. Holt Elementary School, Southern Alamance Middle School, and Southern Alamance High School.
Ownership History
Date
Name
Owned For
Owner Type
Purchase Details
Closed on
Nov 30, 2016
Sold by
George Ashley Marie and George Roger L
Bought by
George Ashley Marie
Current Estimated Value
Home Financials for this Owner
Home Financials are based on the most recent Mortgage that was taken out on this home.
Original Mortgage
$108,974
Outstanding Balance
$87,253
Interest Rate
3.25%
Mortgage Type
FHA
Estimated Equity
$189,408
Purchase Details
Closed on
Jan 22, 2010
Sold by
Jones Matthew A
Bought by
Jones Ashley M
Purchase Details
Closed on
Feb 24, 2009
Sold by
Martin Joel S
Bought by
Jones Ashley M
Home Financials for this Owner
Home Financials are based on the most recent Mortgage that was taken out on this home.
Original Mortgage
$100,152
Interest Rate
5.03%
Mortgage Type
FHA
Purchase Details
Closed on
Oct 14, 2008
Sold by
Branch Banking And Trust
Bought by
Martin Joel
Create a Home Valuation Report for This Property
The Home Valuation Report is an in-depth analysis detailing your home's value as well as a comparison with similar homes in the area
Home Values in the Area
Average Home Value in this Area
Purchase History
| Date | Buyer | Sale Price | Title Company |
|---|---|---|---|
| George Ashley Marie | -- | None Available | |
| Jones Ashley M | -- | -- | |
| Jones Ashley M | $102,000 | -- | |
| Martin Joel | $56,000 | -- |
Source: Public Records
Mortgage History
| Date | Status | Borrower | Loan Amount |
|---|---|---|---|
| Open | George Ashley Marie | $108,974 | |
| Previous Owner | Jones Ashley M | $100,152 | |
| Closed | Martin Joel | $0 |
Source: Public Records
Tax History Compared to Growth
Tax History
| Year | Tax Paid | Tax Assessment Tax Assessment Total Assessment is a certain percentage of the fair market value that is determined by local assessors to be the total taxable value of land and additions on the property. | Land | Improvement |
|---|---|---|---|---|
| 2025 | $1,127 | $186,794 | $33,744 | $153,050 |
| 2024 | $1,024 | $186,794 | $33,744 | $153,050 |
| 2023 | $950 | $186,794 | $33,744 | $153,050 |
| 2022 | $854 | $111,836 | $23,162 | $88,674 |
| 2021 | $865 | $111,836 | $23,162 | $88,674 |
| 2020 | $876 | $111,836 | $23,162 | $88,674 |
| 2019 | $881 | $111,836 | $23,162 | $88,674 |
| 2018 | $0 | $111,836 | $23,162 | $88,674 |
| 2017 | $780 | $111,836 | $23,162 | $88,674 |
| 2016 | $772 | $112,257 | $24,525 | $87,732 |
| 2015 | $768 | $112,257 | $24,525 | $87,732 |
| 2014 | $712 | $112,257 | $24,525 | $87,732 |
Source: Public Records
Map
Nearby Homes
- 4105 Keepee Trail
- 4053 Friendship Patterson Mill Rd
- 3902 Chucks Ct
- 3991 Bellemont Mount Hermon Rd
- 1629 Alyece Ct
- 3567 Bellemont Mount Hermon Rd
- 4105 Ralph Holt Ct
- 4109 Ralph Holt Ct
- 4152 Boyd Wright Rd
- 2834 Bellemont Alamance Rd
- 2832 Russell McPherson Rd
- 1334 Bellemont Ln
- 4524 W Millstone Dr
- 4524 W Millstone Dr Unit 12
- 4470 S Nc Highway 62
- 2524 Covington Loop
- 4459 S Nc Highway 62
- 2619 Pepperstone Dr
- 0 Brookstone Dr
- 665 Brycewood Dr
- 5413 State Highway 49
- 5419 S Nc Highway 49
- 5419 State Highway 49
- 5419 N Carolina 49
- 5405 S Nc Highway 49
- 5427 S Nc Highway 49
- 5427 State Highway 49
- 5410 S Nc Highway 49
- 5420 S Nc Highway 49
- 5435 S Nc Highway 49
- 5443 S Nc Highway 49
- 5434 S Nc Highway 49
- 5384 S Nc Highway 49
- 5434 State Highway 49
- 5451 S Nc Highway 49
- 5359 State Highway 49
- 5359 S Nc Highway 49
- 5359 N Carolina 49
- 5356 S Nc Highway 49
- 5457 S Nc Highway 49