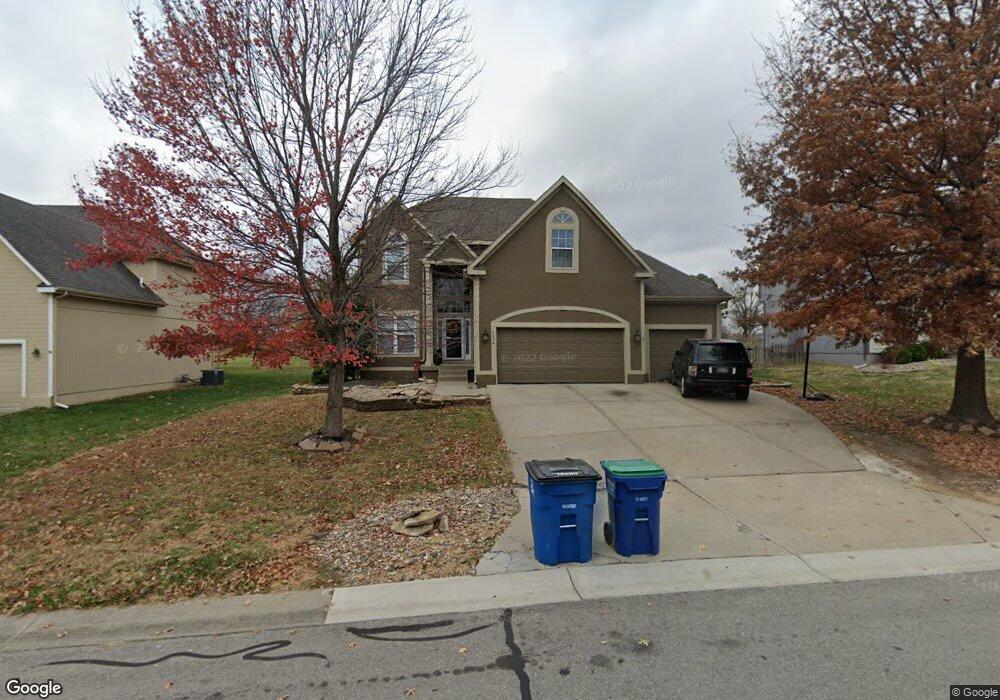
5414 Gleason Rd Shawnee, KS 66226
Estimated Value: $420,000 - $452,000
4
Beds
4
Baths
2,158
Sq Ft
$203/Sq Ft
Est. Value
About This Home
This home is located at 5414 Gleason Rd, Shawnee, KS 66226 and is currently estimated at $437,519, approximately $202 per square foot. 5414 Gleason Rd is a home located in Johnson County with nearby schools including Belmont Elementary School, Mill Creek Middle School, and Mill Valley High School.
Ownership History
Date
Name
Owned For
Owner Type
Purchase Details
Closed on
Apr 6, 2007
Sold by
Household Finance Corp Iii
Bought by
Brethorst Jeff L
Current Estimated Value
Home Financials for this Owner
Home Financials are based on the most recent Mortgage that was taken out on this home.
Original Mortgage
$169,200
Outstanding Balance
$102,303
Interest Rate
6.15%
Mortgage Type
New Conventional
Estimated Equity
$335,216
Purchase Details
Closed on
Nov 21, 2006
Sold by
Garrens Dustin D and Cascio Kimberly K
Bought by
Household Finance Corp Iii
Purchase Details
Closed on
Aug 22, 2001
Sold by
Gable Custom Homes & Improvements Inc
Bought by
Garrens Dustin D and Garrens Kimberly K
Home Financials for this Owner
Home Financials are based on the most recent Mortgage that was taken out on this home.
Original Mortgage
$215,000
Interest Rate
7.07%
Create a Home Valuation Report for This Property
The Home Valuation Report is an in-depth analysis detailing your home's value as well as a comparison with similar homes in the area
Home Values in the Area
Average Home Value in this Area
Purchase History
| Date | Buyer | Sale Price | Title Company |
|---|---|---|---|
| Brethorst Jeff L | -- | Mokan Title Services Inc | |
| Household Finance Corp Iii | $216,752 | Chicago Title Insurnce Co | |
| Garrens Dustin D | -- | Security Land Title Company |
Source: Public Records
Mortgage History
| Date | Status | Borrower | Loan Amount |
|---|---|---|---|
| Open | Brethorst Jeff L | $169,200 | |
| Previous Owner | Garrens Dustin D | $215,000 |
Source: Public Records
Tax History Compared to Growth
Tax History
| Year | Tax Paid | Tax Assessment Tax Assessment Total Assessment is a certain percentage of the fair market value that is determined by local assessors to be the total taxable value of land and additions on the property. | Land | Improvement |
|---|---|---|---|---|
| 2024 | $5,344 | $46,000 | $7,990 | $38,010 |
| 2023 | $5,259 | $44,735 | $7,990 | $36,745 |
| 2022 | $4,980 | $41,503 | $6,940 | $34,563 |
| 2021 | $4,687 | $37,536 | $6,609 | $30,927 |
| 2020 | $4,228 | $33,534 | $6,609 | $26,925 |
| 2019 | $4,122 | $32,211 | $5,499 | $26,712 |
| 2018 | $4,019 | $31,130 | $5,499 | $25,631 |
| 2017 | $3,936 | $29,739 | $5,211 | $24,528 |
| 2016 | $3,773 | $28,152 | $5,211 | $22,941 |
| 2015 | $3,630 | $26,646 | $5,211 | $21,435 |
| 2013 | -- | $25,288 | $5,216 | $20,072 |
Source: Public Records
Map
Nearby Homes
- 5858 Mccormick Dr
- 5625 Meadow View Dr
- 5221 Meadow View Dr
- 5137 Meadowlark Dr
- 5764 Apache Dr
- The Paxton III Plan at Canyon Lakes
- The Sydney III Plan at Canyon Lakes
- The Harlow V Plan at Canyon Lakes
- The Hailey Plan at Canyon Lakes
- The Brooklyn II Plan at Canyon Lakes
- The Niko Plan at Canyon Lakes
- The Payton Plan at Canyon Lakes
- The Aspen Plan at Canyon Lakes
- The Levi II Plan at Canyon Lakes
- The Madison Plan at Canyon Lakes
- The Ellsworth Plan at Canyon Lakes
- The Dakota Plan at Canyon Lakes
- The Ashland Plan at Canyon Lakes
- The Davidson II Plan at Canyon Lakes
- 6018 Apache Dr
- 5410 Gleason Rd
- 5418 Gleason Rd
- 5406 Gleason Rd
- 5411 Gleason Rd
- 5407 Gleason Rd
- 5402 Gleason Rd
- 23805 W 54th Terrace
- 23950 W 55th St
- 5403 Gleason Rd
- 5344 Gleason Rd
- 23717 W 54th Terrace
- 5347 Gleason Rd
- 23711 W 54th St
- 23714 W 54th Terrace
- 5522 Gleason Rd
- 5339 Lewis Ct
- 5340 Gleason Rd
- 5525 Lewis Dr
- 5343 Gleason Rd
- 24000 W 55th St