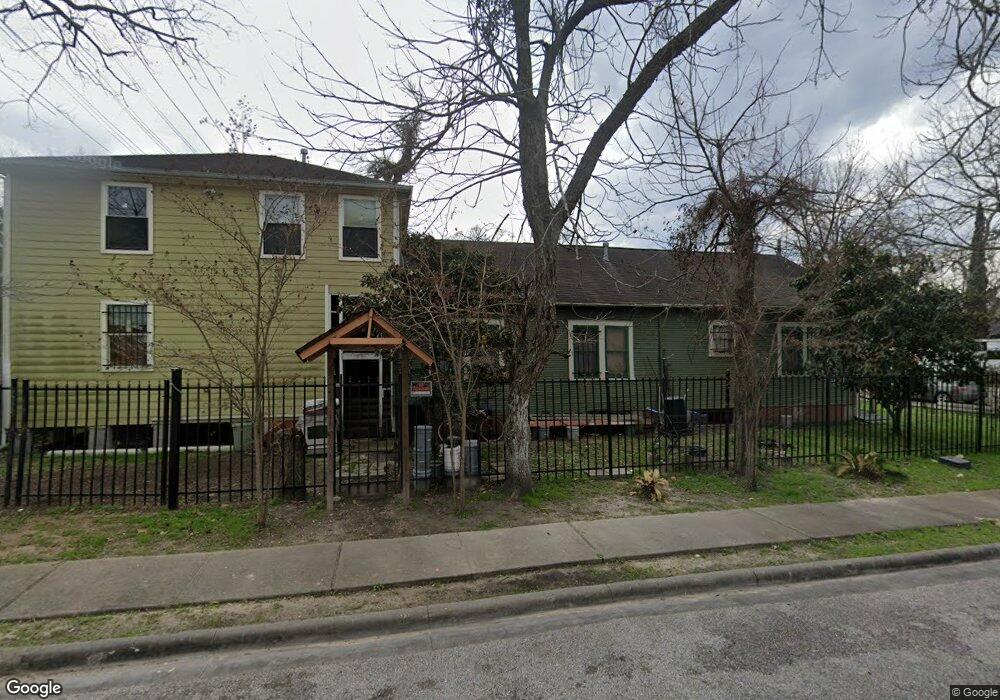
5414 Hardy St Houston, TX 77009
Ryon NeighborhoodEstimated Value: $306,854 - $427,000
1
Bed
2
Baths
2,540
Sq Ft
$143/Sq Ft
Est. Value
About This Home
This home is located at 5414 Hardy St, Houston, TX 77009 and is currently estimated at $362,214, approximately $142 per square foot. 5414 Hardy St is a home located in Harris County with nearby schools including Jefferson Elementary School, Marshall Middle, and Northside High School.
Ownership History
Date
Name
Owned For
Owner Type
Purchase Details
Closed on
May 21, 2004
Sold by
Avenue Community Development Corp
Bought by
Delacruz Maria I and Delacruz Jose Manuel
Current Estimated Value
Home Financials for this Owner
Home Financials are based on the most recent Mortgage that was taken out on this home.
Original Mortgage
$73,200
Outstanding Balance
$35,067
Interest Rate
5.81%
Mortgage Type
Purchase Money Mortgage
Estimated Equity
$327,147
Purchase Details
Closed on
Nov 10, 2002
Sold by
Aranza Rosemarie
Bought by
Avenue Community Development Corp
Create a Home Valuation Report for This Property
The Home Valuation Report is an in-depth analysis detailing your home's value as well as a comparison with similar homes in the area
Home Values in the Area
Average Home Value in this Area
Purchase History
| Date | Buyer | Sale Price | Title Company |
|---|---|---|---|
| Delacruz Maria I | -- | Stewart Title Company | |
| Avenue Community Development Corp | -- | Stewart Title Company |
Source: Public Records
Mortgage History
| Date | Status | Borrower | Loan Amount |
|---|---|---|---|
| Open | Delacruz Maria I | $73,200 | |
| Closed | Delacruz Maria I | $5,000 |
Source: Public Records
Tax History Compared to Growth
Tax History
| Year | Tax Paid | Tax Assessment Tax Assessment Total Assessment is a certain percentage of the fair market value that is determined by local assessors to be the total taxable value of land and additions on the property. | Land | Improvement |
|---|---|---|---|---|
| 2025 | $64 | $284,266 | $150,000 | $134,266 |
| 2024 | $64 | $279,203 | $150,000 | $129,203 |
| 2023 | $64 | $277,536 | $125,000 | $152,536 |
| 2022 | $4,415 | $273,261 | $125,000 | $148,261 |
| 2021 | $4,248 | $215,719 | $85,000 | $130,719 |
| 2020 | $4,012 | $223,773 | $85,000 | $138,773 |
| 2019 | $3,812 | $223,773 | $85,000 | $138,773 |
| 2018 | $443 | $167,422 | $60,000 | $107,422 |
| 2017 | $3,148 | $156,803 | $50,000 | $106,803 |
| 2016 | $2,862 | $139,238 | $45,000 | $94,238 |
| 2015 | $536 | $123,761 | $27,500 | $96,261 |
| 2014 | $536 | $93,531 | $22,500 | $71,031 |
Source: Public Records
Map
Nearby Homes