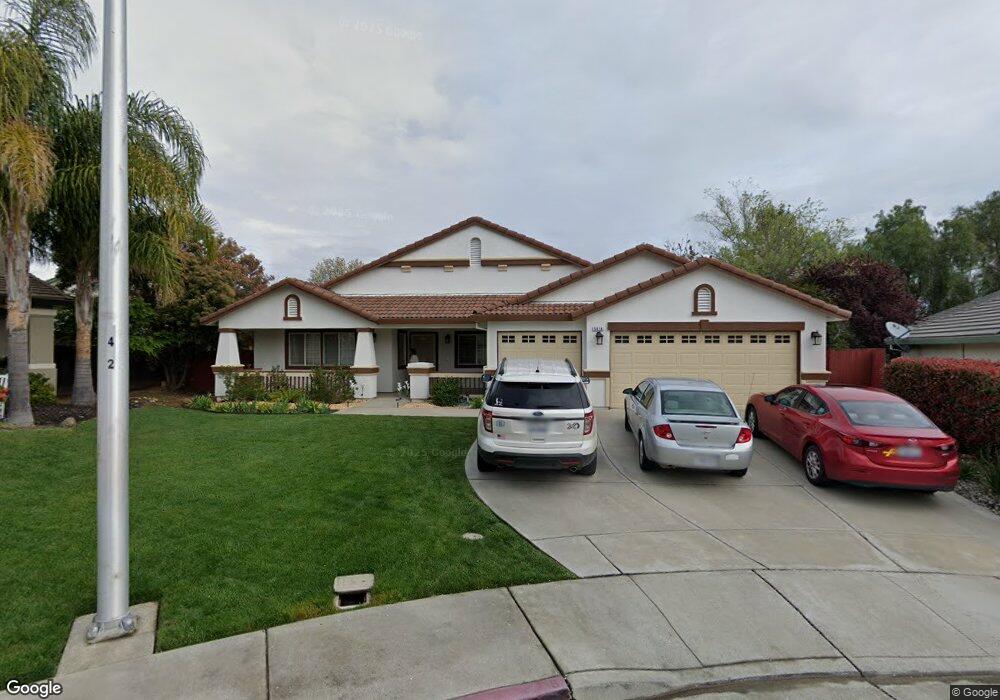
5414 Navajo Ct Antioch, CA 94531
Lone Tree Valley NeighborhoodEstimated Value: $689,000 - $756,866
4
Beds
3
Baths
2,422
Sq Ft
$297/Sq Ft
Est. Value
About This Home
This home is located at 5414 Navajo Ct, Antioch, CA 94531 and is currently estimated at $720,217, approximately $297 per square foot. 5414 Navajo Ct is a home located in Contra Costa County with nearby schools including Diablo Vista Elementary School, Dallas Ranch Middle School, and Deer Valley High School.
Ownership History
Date
Name
Owned For
Owner Type
Purchase Details
Closed on
May 31, 2016
Sold by
Clegg Don Ray and Clegg Sofia Alba Pantin
Bought by
Thurston Ross David and Thurston Gayle Williams
Current Estimated Value
Home Financials for this Owner
Home Financials are based on the most recent Mortgage that was taken out on this home.
Original Mortgage
$441,849
Outstanding Balance
$351,892
Interest Rate
3.59%
Mortgage Type
FHA
Estimated Equity
$368,325
Purchase Details
Closed on
Jun 16, 2014
Sold by
Clegg Don R and Clegg Sofia P
Bought by
Clegg Family 2006 Revocable Trust
Purchase Details
Closed on
Jun 8, 1999
Sold by
Hph Homebuilders 1996 Lp
Bought by
Clegg Don R and Clegg Sofia P
Home Financials for this Owner
Home Financials are based on the most recent Mortgage that was taken out on this home.
Original Mortgage
$184,474
Interest Rate
7.64%
Mortgage Type
Purchase Money Mortgage
Create a Home Valuation Report for This Property
The Home Valuation Report is an in-depth analysis detailing your home's value as well as a comparison with similar homes in the area
Home Values in the Area
Average Home Value in this Area
Purchase History
| Date | Buyer | Sale Price | Title Company |
|---|---|---|---|
| Thurston Ross David | $450,000 | North American Title Co Inc | |
| Clegg Family 2006 Revocable Trust | -- | None Available | |
| Clegg Don R | $257,500 | Old Republic Title Company |
Source: Public Records
Mortgage History
| Date | Status | Borrower | Loan Amount |
|---|---|---|---|
| Open | Thurston Ross David | $441,849 | |
| Previous Owner | Clegg Don R | $184,474 |
Source: Public Records
Tax History Compared to Growth
Tax History
| Year | Tax Paid | Tax Assessment Tax Assessment Total Assessment is a certain percentage of the fair market value that is determined by local assessors to be the total taxable value of land and additions on the property. | Land | Improvement |
|---|---|---|---|---|
| 2025 | $6,092 | $532,701 | $130,214 | $402,487 |
| 2024 | $5,875 | $522,257 | $127,661 | $394,596 |
| 2023 | $5,875 | $512,017 | $125,158 | $386,859 |
| 2022 | $5,783 | $501,978 | $122,704 | $379,274 |
| 2021 | $5,611 | $492,137 | $120,299 | $371,838 |
| 2019 | $5,490 | $477,542 | $116,732 | $360,810 |
| 2018 | $5,284 | $468,180 | $114,444 | $353,736 |
| 2017 | $5,177 | $459,000 | $112,200 | $346,800 |
| 2016 | $4,092 | $355,736 | $64,912 | $290,824 |
| 2015 | $4,390 | $350,393 | $63,937 | $286,456 |
| 2014 | $5,194 | $343,530 | $62,685 | $280,845 |
Source: Public Records
Map
Nearby Homes
- 5428 Golden Eagle St
- 5424 Golden Eagle St
- 5436 Raven Way
- 5420 Golden Eagle St
- 5416 Golden Eagle St
- 5405 Kestrel Ct
- 5400 Kestrel Ct
- 5409 Kestrel Ct
- 5244 Kestrel St
- 5272 Kestrel St
- 5260 Kestrel St
- 5240 Kestrel St
- 5232 Kestrel St
- 5228 Kestrel St
- 5224 Kestrel St
- 5200 Mohican Way
- Residence 5 Plan at Deer Valley
- Residence 4 Plan at Deer Valley
- Residence 3 Plan at Deer Valley
- Residence 6 Plan at Deer Valley
- 5410 Navajo Ct
- 5418 Navajo Ct
- 5407 Piute Ct
- 5411 Piute Ct
- 5254 Feather Way
- 5406 Navajo Ct
- 5258 Feather Way
- 5250 Feather Way
- 5417 Shoshonee Ct
- 5419 Navajo Ct
- 5408 Mojave Way
- 5415 Navajo Ct
- 5411 Navajo Ct
- 5246 Feather Way
- 5418 Shoshonee Ct
- 5404 Mojave Way
- 5414 Piute Ct
- 5407 Navajo Ct
- 5400 Mojave Way
- 5413 Shoshonee Ct