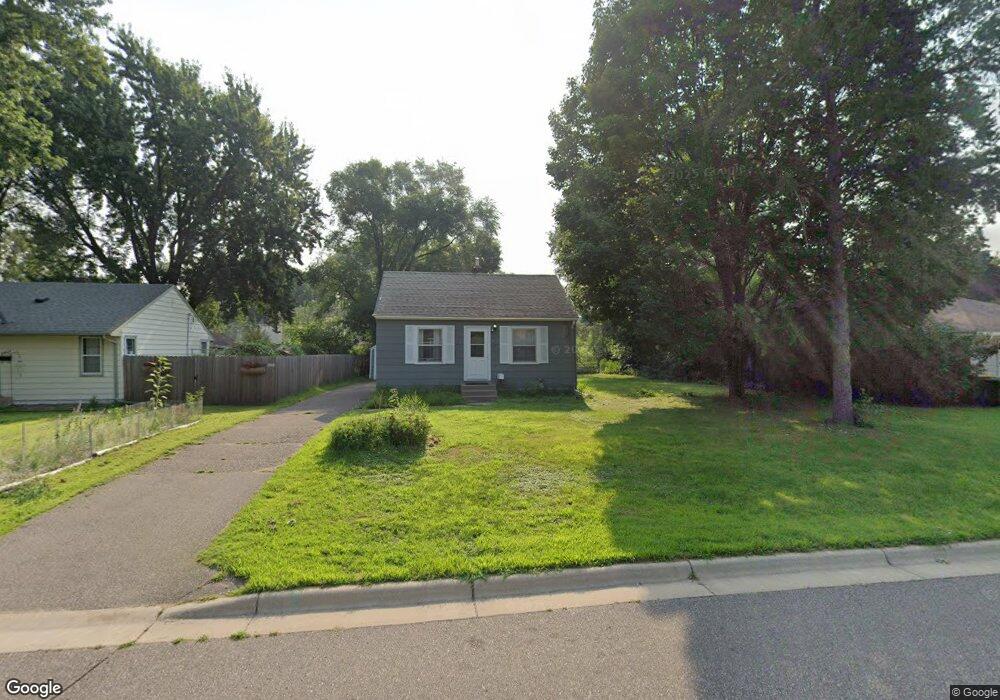
5414 Xenia Ave N Minneapolis, MN 55429
Twin Oaks NeighborhoodEstimated Value: $274,000 - $302,449
3
Beds
2
Baths
1,604
Sq Ft
$177/Sq Ft
Est. Value
About This Home
This home is located at 5414 Xenia Ave N, Minneapolis, MN 55429 and is currently estimated at $283,612, approximately $176 per square foot. 5414 Xenia Ave N is a home located in Hennepin County with nearby schools including Northport Elementary School, Robbinsdale Middle School, and Robbinsdale Cooper Senior High School.
Ownership History
Date
Name
Owned For
Owner Type
Purchase Details
Closed on
Aug 1, 2023
Sold by
Pederson Chanel and Pederson Samuel
Bought by
Karanja Ian Gichane and Gichane Karanja
Current Estimated Value
Home Financials for this Owner
Home Financials are based on the most recent Mortgage that was taken out on this home.
Original Mortgage
$241,800
Outstanding Balance
$236,442
Interest Rate
6.96%
Mortgage Type
New Conventional
Estimated Equity
$47,170
Purchase Details
Closed on
Apr 19, 2021
Sold by
Carlson Noah
Bought by
Pederson Chanel
Home Financials for this Owner
Home Financials are based on the most recent Mortgage that was taken out on this home.
Original Mortgage
$191,090
Interest Rate
3.05%
Mortgage Type
New Conventional
Purchase Details
Closed on
Feb 4, 2019
Sold by
Viravong Vieng Christina
Bought by
Carlson Noah
Purchase Details
Closed on
Dec 17, 2009
Sold by
M&I Marshall & Ilsley Bank
Bought by
Viravong Vieng Christina
Purchase Details
Closed on
Sep 12, 2007
Sold by
Gomez Edgar and Jordan Sheila M
Bought by
Galaz Cortes Ruben and Munoz Karina
Purchase Details
Closed on
Sep 27, 2002
Sold by
Lodermeier Douglas J and Martatos Christine
Bought by
Jordan Sheila M
Create a Home Valuation Report for This Property
The Home Valuation Report is an in-depth analysis detailing your home's value as well as a comparison with similar homes in the area
Home Values in the Area
Average Home Value in this Area
Purchase History
| Date | Buyer | Sale Price | Title Company |
|---|---|---|---|
| Karanja Ian Gichane | $260,000 | Title Choice | |
| Pederson Chanel | $197,000 | Edgewater Title Group Llc | |
| Carlson Noah | $170,000 | Edgewater Title Group | |
| Viravong Vieng Christina | $64,000 | -- | |
| Galaz Cortes Ruben | $195,000 | -- | |
| Jordan Sheila M | $161,500 | -- |
Source: Public Records
Mortgage History
| Date | Status | Borrower | Loan Amount |
|---|---|---|---|
| Open | Karanja Ian Gichane | $241,800 | |
| Previous Owner | Pederson Chanel | $191,090 |
Source: Public Records
Tax History Compared to Growth
Tax History
| Year | Tax Paid | Tax Assessment Tax Assessment Total Assessment is a certain percentage of the fair market value that is determined by local assessors to be the total taxable value of land and additions on the property. | Land | Improvement |
|---|---|---|---|---|
| 2024 | $3,594 | $248,500 | $86,100 | $162,400 |
| 2023 | $3,476 | $258,600 | $95,600 | $163,000 |
| 2022 | $3,201 | $255,000 | $95,000 | $160,000 |
| 2021 | $3,753 | $225,000 | $85,000 | $140,000 |
| 2020 | $3,325 | $202,000 | $69,000 | $133,000 |
| 2019 | $3,772 | $185,000 | $70,000 | $115,000 |
| 2018 | $3,058 | $160,000 | $55,000 | $105,000 |
| 2017 | $3,142 | $144,000 | $45,000 | $99,000 |
| 2016 | $1,944 | $134,000 | $37,000 | $97,000 |
| 2015 | $1,780 | $126,000 | $35,000 | $91,000 |
| 2014 | -- | $110,000 | $32,000 | $78,000 |
Source: Public Records
Map
Nearby Homes
- 5438 Xenia Ave N
- 5208 Hanson Ct N
- 5401 Scott Ave N
- 5608 Vera Cruz Ave N
- 5344 52nd Ave N
- 5101 56th Ave N
- 5017 Wilshire Blvd
- 5014 Angeline Ave N
- 5002 Welcome Ave N
- 5301 Edgewood Ave N
- 5300 Fairview Ave N
- 5716 Elmhurst Ave
- 5114 Florida Ave N
- 5237 Georgia Ave N
- 5748 Elmhurst Ave
- 6514 57th Ave N
- 5003 Fairview Ave N
- 5108 Lakeside Ave N
- 4725 Zane Ave N
- 5924 Regent Ave N
- 5422 Xenia Ave N
- 5618 54th Ave N
- 5612 54th Ave N
- 5612 5612 54th-Avenue-n
- 5409 Welcome Ave N
- 5608 54th Ave N
- 5423 Welcome Ave N
- 5430 Xenia Ave N
- 5600 54th Ave N
- 5431 Welcome Ave N
- 5413 Xenia Ave N
- 5423 Xenia Ave N
- 5316 Xenia Ave N
- 5403 Xenia Ave N
- 5705 Wilshire Blvd
- 5609 Wilshire Blvd
- 5325 Welcome Ave N
- 5325 Xenia Ave N
- 5709 Wilshire Blvd
- 5308 Xenia Ave N