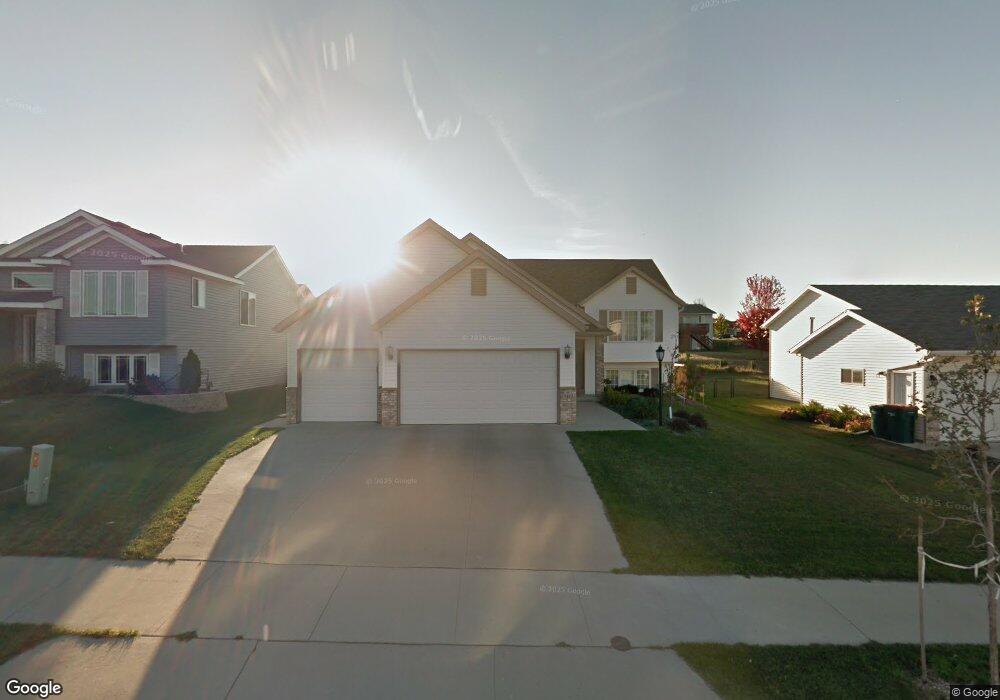
5415 55th Ave NW Rochester, MN 55901
Wedgewood Hills NeighborhoodEstimated Value: $403,000 - $432,000
4
Beds
2
Baths
2,509
Sq Ft
$166/Sq Ft
Est. Value
About This Home
This home is located at 5415 55th Ave NW, Rochester, MN 55901 and is currently estimated at $415,493, approximately $165 per square foot. 5415 55th Ave NW is a home located in Olmsted County with nearby schools including George W. Gibbs Elementary School, John Marshall Senior High School, and Rochester Beacon Academy.
Ownership History
Date
Name
Owned For
Owner Type
Purchase Details
Closed on
Nov 5, 2020
Sold by
Conrad Mark and Conrad My
Bought by
Mccane Casey and Mccane Lindsey
Current Estimated Value
Home Financials for this Owner
Home Financials are based on the most recent Mortgage that was taken out on this home.
Original Mortgage
$313,300
Outstanding Balance
$278,792
Interest Rate
2.8%
Mortgage Type
New Conventional
Estimated Equity
$136,701
Purchase Details
Closed on
Jun 21, 2019
Sold by
Trost Landon W and Trost Jennifer L
Bought by
Conrad My and Conrad Mark
Home Financials for this Owner
Home Financials are based on the most recent Mortgage that was taken out on this home.
Original Mortgage
$278,730
Interest Rate
4%
Mortgage Type
New Conventional
Purchase Details
Closed on
May 21, 2006
Sold by
Lurken Leslie and Lurken Raegen
Bought by
Trost Landon W and Trost Jennifer L
Home Financials for this Owner
Home Financials are based on the most recent Mortgage that was taken out on this home.
Original Mortgage
$155,920
Interest Rate
6.2%
Mortgage Type
New Conventional
Create a Home Valuation Report for This Property
The Home Valuation Report is an in-depth analysis detailing your home's value as well as a comparison with similar homes in the area
Home Values in the Area
Average Home Value in this Area
Purchase History
| Date | Buyer | Sale Price | Title Company |
|---|---|---|---|
| Mccane Casey | $330,000 | None Available | |
| Conrad My | $293,400 | Rochester Title & Escrow Co | |
| Trost Landon W | $194,900 | Edina Title Rochester | |
| Mccane Casey Casey | $330,000 | -- |
Source: Public Records
Mortgage History
| Date | Status | Borrower | Loan Amount |
|---|---|---|---|
| Open | Mccane Casey | $313,300 | |
| Previous Owner | Conrad My | $278,730 | |
| Previous Owner | Trost Landon W | $155,920 | |
| Closed | Mccane Casey Casey | $313,300 |
Source: Public Records
Tax History Compared to Growth
Tax History
| Year | Tax Paid | Tax Assessment Tax Assessment Total Assessment is a certain percentage of the fair market value that is determined by local assessors to be the total taxable value of land and additions on the property. | Land | Improvement |
|---|---|---|---|---|
| 2024 | $5,086 | $374,200 | $60,000 | $314,200 |
| 2023 | $4,320 | $348,100 | $40,000 | $308,100 |
| 2022 | $3,948 | $351,300 | $40,000 | $311,300 |
| 2021 | $3,876 | $296,100 | $40,000 | $256,100 |
| 2020 | $3,936 | $290,800 | $40,000 | $250,800 |
| 2019 | $3,396 | $284,100 | $40,000 | $244,100 |
| 2018 | $3,056 | $250,100 | $40,000 | $210,100 |
| 2017 | $2,940 | $234,200 | $40,000 | $194,200 |
| 2016 | $2,682 | $198,700 | $36,700 | $162,000 |
| 2015 | $2,466 | $177,000 | $36,000 | $141,000 |
| 2014 | $2,652 | $173,700 | $35,900 | $137,800 |
| 2012 | -- | $190,200 | $36,454 | $153,746 |
Source: Public Records
Map
Nearby Homes
- 5307 55th Ave NW
- 5307 54th Ave NW
- 5519 Sundown Place NW
- 5569 Harrow Ln NW
- 5523 Sundown Place NW
- 5515 Sundown Place NW
- Townhome 2 Plan at Harvest West
- Townhome 3 Plan at Harvest West
- Townhome 4 Plan at Harvest West
- Townhome 1 Plan at Harvest West
- 5386 King Arthur Dr NW
- 5350 King Arthur Dr NW
- 5368 King Arthur Dr NW
- 5425 Queens Dr NW
- 5419 Queens Dr NW
- 5413 Queens Dr NW
- 5407 Queens Dr NW
- 5401 Queens Dr NW
- 5227 Harvest Square Ln NW
- 5203 Harvest Square Ln NW
- 5433 55th Ave NW
- 5397 55th Ave NW
- 5379 5379 55-Avenue-nw
- 5394 Kingston Place NW
- 5379 55th Ave NW
- 5378 Kingston Place NW
- 5410 Kingston Place NW
- 5362 Kingston Place NW
- 5420 55th Ave NW
- 5398 55th Ave NW
- 5398 5398 55-Avenue-nw
- 5426 Kingston Place NW
- 5469 55th Ave NW
- 5361 55th Ave NW
- 5442 55th Ave NW
- 5346 Kingston Place NW
- 5492 Duvall St NW
- 5464 55th Ave NW
- 5330 Kingston Place NW
- 5487 55th Ave NW