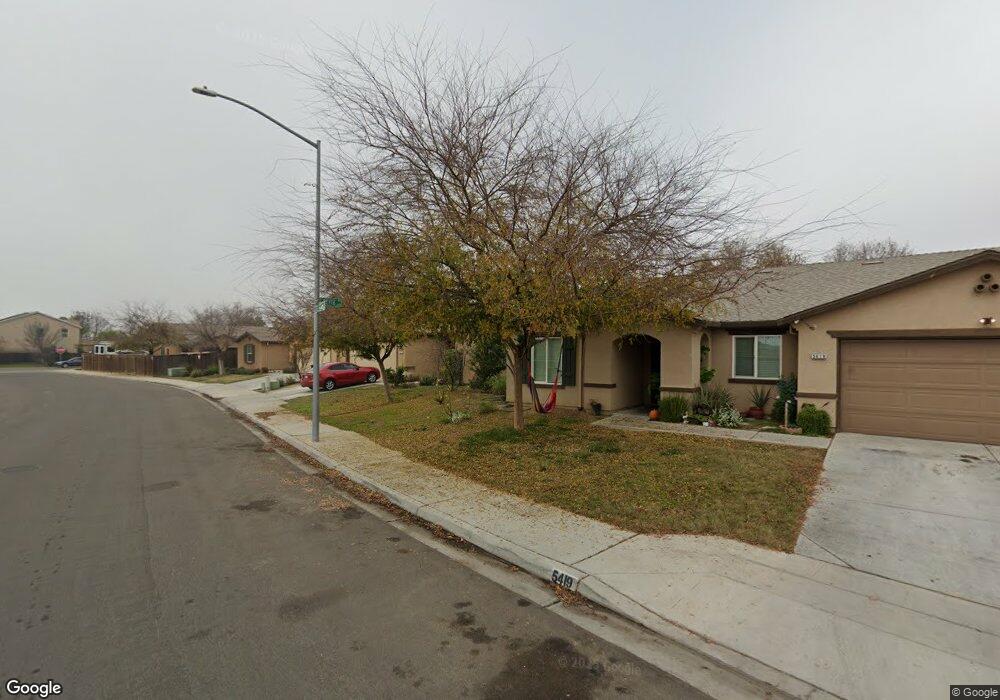
5415 E Tower Ave Fresno, CA 93727
Sunnyside NeighborhoodEstimated Value: $415,000 - $446,000
4
Beds
2
Baths
1,773
Sq Ft
$243/Sq Ft
Est. Value
About This Home
This home is located at 5415 E Tower Ave, Fresno, CA 93727 and is currently estimated at $431,138, approximately $243 per square foot. 5415 E Tower Ave is a home with nearby schools including Lone Star Elementary School, Washington Academic Middle School, and Sanger High School.
Ownership History
Date
Name
Owned For
Owner Type
Purchase Details
Closed on
Nov 4, 2021
Sold by
Ho Trieu Xuan
Bought by
Vo Thuan Thi Minh
Current Estimated Value
Home Financials for this Owner
Home Financials are based on the most recent Mortgage that was taken out on this home.
Original Mortgage
$197,500
Outstanding Balance
$153,125
Interest Rate
2.23%
Mortgage Type
New Conventional
Estimated Equity
$278,013
Purchase Details
Closed on
Apr 21, 2017
Sold by
Vo Thuan Thi Minh and Ta Giang Chi Thi
Bought by
Vo Thuan Thi Minh and Vo Minh Tuyet Thi
Home Financials for this Owner
Home Financials are based on the most recent Mortgage that was taken out on this home.
Original Mortgage
$211,210
Interest Rate
4.3%
Mortgage Type
New Conventional
Purchase Details
Closed on
Feb 26, 2016
Sold by
Kb Home
Bought by
Vo Thuan Thi Minh and Ta Giang Chi Thi
Home Financials for this Owner
Home Financials are based on the most recent Mortgage that was taken out on this home.
Original Mortgage
$201,600
Interest Rate
3.81%
Mortgage Type
New Conventional
Create a Home Valuation Report for This Property
The Home Valuation Report is an in-depth analysis detailing your home's value as well as a comparison with similar homes in the area
Home Values in the Area
Average Home Value in this Area
Purchase History
| Date | Buyer | Sale Price | Title Company |
|---|---|---|---|
| Vo Thuan Thi Minh | -- | Old Republic Title Company | |
| Vo Thuan Thi Minh | -- | Old Republic Title Concord | |
| Vo Thuan Thi Minh | $262,000 | First American Title Company |
Source: Public Records
Mortgage History
| Date | Status | Borrower | Loan Amount |
|---|---|---|---|
| Open | Vo Thuan Thi Minh | $197,500 | |
| Closed | Vo Thuan Thi Minh | $211,210 | |
| Closed | Vo Thuan Thi Minh | $201,600 |
Source: Public Records
Tax History Compared to Growth
Tax History
| Year | Tax Paid | Tax Assessment Tax Assessment Total Assessment is a certain percentage of the fair market value that is determined by local assessors to be the total taxable value of land and additions on the property. | Land | Improvement |
|---|---|---|---|---|
| 2025 | $4,733 | $310,471 | $84,952 | $225,519 |
| 2023 | $4,635 | $298,417 | $81,654 | $216,763 |
| 2022 | $4,447 | $292,566 | $80,053 | $212,513 |
| 2021 | $4,382 | $286,831 | $78,484 | $208,347 |
| 2020 | $4,246 | $283,891 | $77,680 | $206,211 |
| 2019 | $4,244 | $278,325 | $76,157 | $202,168 |
| 2018 | $4,039 | $272,868 | $74,664 | $198,204 |
| 2017 | $4,563 | $267,036 | $71,400 | $195,636 |
| 2016 | $1,316 | $109,441 | $26,441 | $83,000 |
Source: Public Records
Map
Nearby Homes
- 5447 E Burns Ave
- 5420 E Burns Ave
- 2225 S Rachel Ave
- 2466 S Bette
- 120 E Pitt Ave
- 5433 E Geary St
- 5423 E Grove Ave
- 5481 E Geary St
- 5314 E Laurite Ave
- 5576 E Burns Ave
- 2148 S Villa Ave
- Cambridge Plan at Olive Lane
- Windsor Plan at Olive Lane
- Oxford Plan at Olive Lane
- 5335 E Hoxie Ave
- Plan 2155 at Peach Street - Parkside at Peach Avenue
- Plan 1769 Modeled at Peach Street - Parkside at Peach Avenue
- Plan 2554 Modeled at Peach Street - Parkside at Peach Avenue
- Plan 1557 at Peach Street - Parkside at Peach Avenue
- Plan 1384 at Peach Street - Parkside at Peach Avenue
- 5411 E Tower Ave
- 5419 E Tower Ave
- 2371 S Minnewawa Ave
- 2380 S Bette
- 5423 E Tower Ave
- 2367 S Minnewawa Ave
- 2379 S Minnewawa Ave
- 5427 E Tower Ave
- 2381 S Bette
- 2384 S Bette Ave
- 2383 S Minnewawa Ave
- 5431 E Tower Ave
- 5426 E Tower Ave
- 2385 S Bette
- 5396 E Belgravia Ave
- 2388 S Bette Ave
- 2382 S Rabe Ave
- 2389 S Bette Ave
- 5435 E Tower Ave
- 2387 S Minnewawa Ave