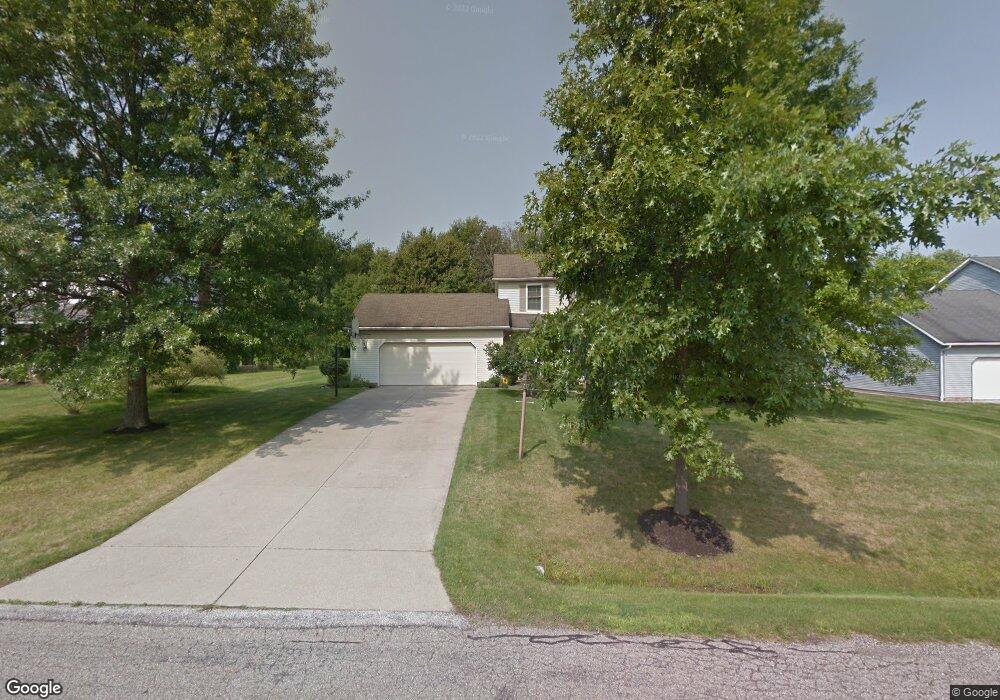
5416 Port Chester Dr Hudson, OH 44236
Estimated Value: $352,000 - $439,000
4
Beds
3
Baths
1,992
Sq Ft
$206/Sq Ft
Est. Value
About This Home
This home is located at 5416 Port Chester Dr, Hudson, OH 44236 and is currently estimated at $411,002, approximately $206 per square foot. 5416 Port Chester Dr is a home located in Summit County with nearby schools including Ellsworth Hill Elementary School, East Woods Intermediate School, and Hudson Middle School.
Ownership History
Date
Name
Owned For
Owner Type
Purchase Details
Closed on
Oct 31, 2023
Sold by
Katitus Robert L
Bought by
Katitus Marrie A
Current Estimated Value
Purchase Details
Closed on
May 25, 2002
Sold by
Catron Kim L and Catron Elizabeth L
Bought by
Katitus Robert L and Katitus Marrie A
Home Financials for this Owner
Home Financials are based on the most recent Mortgage that was taken out on this home.
Original Mortgage
$168,000
Interest Rate
7%
Mortgage Type
Balloon
Purchase Details
Closed on
Oct 14, 2000
Sold by
Baumgartner Ruth C and Baumgartner David
Bought by
Catron Kim L and Catron Elizabeth L
Home Financials for this Owner
Home Financials are based on the most recent Mortgage that was taken out on this home.
Original Mortgage
$147,000
Interest Rate
8.03%
Create a Home Valuation Report for This Property
The Home Valuation Report is an in-depth analysis detailing your home's value as well as a comparison with similar homes in the area
Home Values in the Area
Average Home Value in this Area
Purchase History
| Date | Buyer | Sale Price | Title Company |
|---|---|---|---|
| Katitus Marrie A | -- | Stewart Title | |
| Katitus Robert L | $225,000 | Cleveland Title | |
| Catron Kim L | $217,000 | Midland Commerce Group |
Source: Public Records
Mortgage History
| Date | Status | Borrower | Loan Amount |
|---|---|---|---|
| Previous Owner | Katitus Robert L | $168,000 | |
| Previous Owner | Catron Kim L | $147,000 | |
| Closed | Katitus Robert L | $10,000 |
Source: Public Records
Tax History Compared to Growth
Tax History
| Year | Tax Paid | Tax Assessment Tax Assessment Total Assessment is a certain percentage of the fair market value that is determined by local assessors to be the total taxable value of land and additions on the property. | Land | Improvement |
|---|---|---|---|---|
| 2025 | $5,799 | $113,691 | $20,003 | $93,688 |
| 2024 | $5,799 | $113,691 | $20,003 | $93,688 |
| 2023 | $5,799 | $113,691 | $20,003 | $93,688 |
| 2022 | $5,467 | $95,652 | $16,811 | $78,841 |
| 2021 | $5,476 | $95,652 | $16,811 | $78,841 |
| 2020 | $5,380 | $95,650 | $16,810 | $78,840 |
| 2019 | $5,152 | $84,750 | $16,810 | $67,940 |
| 2018 | $5,134 | $84,750 | $16,810 | $67,940 |
| 2017 | $4,863 | $84,750 | $16,810 | $67,940 |
| 2016 | $4,898 | $78,000 | $16,810 | $61,190 |
| 2015 | $4,863 | $78,000 | $16,810 | $61,190 |
| 2014 | $4,877 | $78,000 | $16,810 | $61,190 |
| 2013 | $4,836 | $75,530 | $16,810 | $58,720 |
Source: Public Records
Map
Nearby Homes
- 0 Lincoln Blvd
- 5491 Sullivan Rd
- 5469 Sullivan Rd
- 166 W Barlow Rd
- 4844 State Rd
- 4850 State Rd
- HOLLISTER Plan at Reserve at Boulder Estates
- ALDEN Plan at Reserve at Boulder Estates
- PARKETTE Plan at Reserve at Boulder Estates
- BELLEVILLE Plan at Reserve at Boulder Estates
- VANDERBURGH Plan at Reserve at Boulder Estates
- BUCHANAN Plan at Reserve at Boulder Estates
- BEACHWOOD Plan at Reserve at Boulder Estates
- 4959 Hudson Dr
- 5532 Hudson Dr
- 6170 Nicholson Dr
- 28 Boulder Blvd
- 52 Boulder Blvd
- 4839 Lake View Dr
- V/L Diplomat Dr
- 5426 Port Chester Dr
- 5406 Port Chester Dr
- 5436 Port Chester Dr
- 5396 Port Chester Dr
- 5415 Port Chester Dr
- 5427 Port Chester Dr
- 5407 Port Chester Dr
- 5446 Port Chester Dr
- 5386 Port Chester Dr
- 5435 Port Chester Dr
- 5441 Port Chester Dr
- 5456 Port Chester Dr
- 5376 Port Chester Dr
- 5387 Port Chester Dr
- 5424 Towbridge Dr
- 5453 Port Chester Dr
- 5222 Towbridge Dr
- 5430 Towbridge Dr
- 5213 Towbridge Dr
- 5375 Port Chester Dr