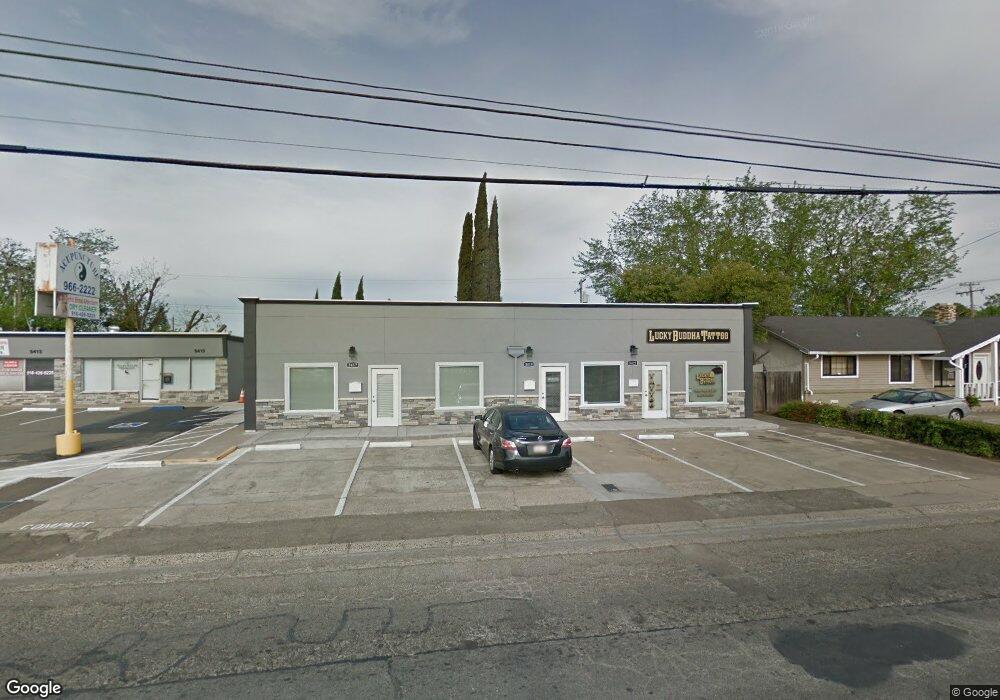
5417 San Juan Ave Citrus Heights, CA 95610
Estimated Value: $568,043
--
Bed
--
Bath
--
Sq Ft
8,276
Sq Ft Lot
About This Home
This home is located at 5417 San Juan Ave, Citrus Heights, CA 95610 and is currently estimated at $568,043. 5417 San Juan Ave is a home located in Sacramento County with nearby schools including Charles Peck Elementary School, Will Rogers Middle School, and San Juan High School.
Ownership History
Date
Name
Owned For
Owner Type
Purchase Details
Closed on
May 2, 2018
Sold by
New Hope Holdings Llc
Bought by
Rowley Investments Llc
Current Estimated Value
Home Financials for this Owner
Home Financials are based on the most recent Mortgage that was taken out on this home.
Original Mortgage
$300,000
Outstanding Balance
$258,607
Interest Rate
4.45%
Mortgage Type
Commercial
Estimated Equity
$309,436
Purchase Details
Closed on
Dec 11, 2015
Sold by
Tang Bong Yin and Tang Pui Yin
Bought by
New Hope Holdings Llc
Purchase Details
Closed on
Jan 28, 2003
Sold by
Tang Bong Yin and Tang Pui Yin
Bought by
Tang Bong Yin and Tang Pui Yin
Purchase Details
Closed on
Oct 12, 2001
Sold by
Scannell Paul R and Newton Laurie
Bought by
Nguyen Thu T
Home Financials for this Owner
Home Financials are based on the most recent Mortgage that was taken out on this home.
Original Mortgage
$112,000
Interest Rate
6.88%
Mortgage Type
Commercial
Create a Home Valuation Report for This Property
The Home Valuation Report is an in-depth analysis detailing your home's value as well as a comparison with similar homes in the area
Home Values in the Area
Average Home Value in this Area
Purchase History
| Date | Buyer | Sale Price | Title Company |
|---|---|---|---|
| Rowley Investments Llc | $400,000 | Fidelity National Title Comp | |
| New Hope Holdings Llc | $375,000 | Old Republic Title Company | |
| Tang Bong Yin | -- | -- | |
| Nguyen Thu T | $140,000 | North American Title Co |
Source: Public Records
Mortgage History
| Date | Status | Borrower | Loan Amount |
|---|---|---|---|
| Open | Rowley Investments Llc | $300,000 | |
| Previous Owner | Nguyen Thu T | $112,000 |
Source: Public Records
Tax History Compared to Growth
Tax History
| Year | Tax Paid | Tax Assessment Tax Assessment Total Assessment is a certain percentage of the fair market value that is determined by local assessors to be the total taxable value of land and additions on the property. | Land | Improvement |
|---|---|---|---|---|
| 2025 | $5,395 | $455,128 | $113,781 | $341,347 |
| 2024 | $5,395 | $446,204 | $111,550 | $334,654 |
| 2023 | $5,258 | $437,456 | $109,363 | $328,093 |
| 2022 | $5,231 | $428,879 | $107,219 | $321,660 |
| 2021 | $5,145 | $420,470 | $105,117 | $315,353 |
| 2020 | $5,049 | $416,160 | $104,040 | $312,120 |
| 2019 | $4,948 | $408,000 | $102,000 | $306,000 |
| 2018 | $4,828 | $396,270 | $78,030 | $318,240 |
| 2017 | $2,209 | $178,500 | $76,500 | $102,000 |
| 2016 | $2,064 | $175,000 | $75,000 | $100,000 |
| 2015 | $2,255 | $191,717 | $90,548 | $101,169 |
| 2014 | $2,208 | $187,963 | $88,775 | $99,188 |
Source: Public Records
Map
Nearby Homes
- 5513 San Juan Ave
- 33 Coyle Creek Cir
- 7230 Linda Sue Way
- 7449 Willowcreek Dr
- 5645 San Juan Ave
- 5664 San Juan Ave
- 5200 Roseana Ct
- 7229 Gail Way
- 7125 Gail Way
- 5718 Southgrove Dr
- 5213 Dove Dr
- 5829 San Juan Ave Unit 5
- 5829 San Juan Ave Unit 39
- 5424 Mariposa Ave
- 5617 Mariposa Ave
- 5437 Elsinore Way
- 7746 Eastgate Ave
- 5829 Sperry Dr
- 7738 Eastgate Ave
- 7632 Capricorn Dr
- 5415 San Juan Ave
- 5413 San Juan Ave
- 5411 San Juan Ave
- 5418 Maidstone Way
- 5412 Maidstone Way
- 5424 Maidstone Way
- 5429 San Juan Ave
- 5406 Maidstone Way
- 5430 Maidstone Way
- 5435 San Juan Ave
- 5436 Maidstone Way
- 5417 Maidstone Way
- 5411 Maidstone Way
- 5400 Maidstone Way
- 5423 Maidstone Way
- 5441 San Juan Ave
- 5401 Maidstone Way
- 5429 Maidstone Way
- 5442 Maidstone Way
- 5480 San Juan Ave