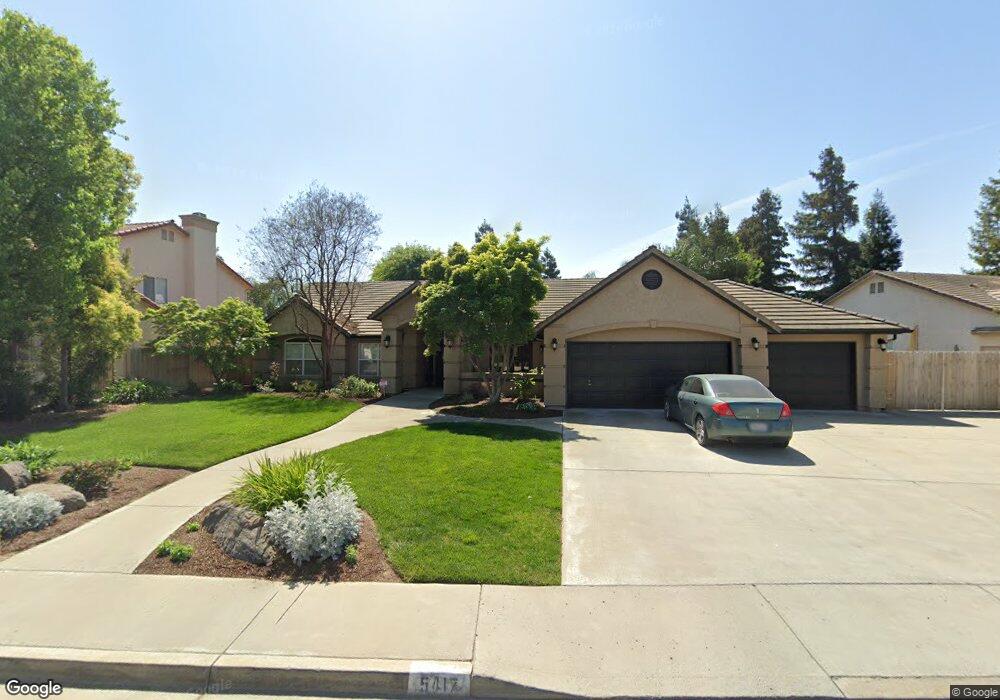
5417 W Buena Vista Ave Visalia, CA 93291
Northwest Visalia NeighborhoodEstimated Value: $660,430 - $697,000
4
Beds
2
Baths
2,611
Sq Ft
$259/Sq Ft
Est. Value
About This Home
This home is located at 5417 W Buena Vista Ave, Visalia, CA 93291 and is currently estimated at $677,358, approximately $259 per square foot. 5417 W Buena Vista Ave is a home located in Tulare County with nearby schools including Hurley Elementary School, Ridgeview Middle, and Redwood High School.
Ownership History
Date
Name
Owned For
Owner Type
Purchase Details
Closed on
May 23, 2024
Sold by
Sciacca Leonard M
Bought by
Leonard Michael Sciacca Living Trust and Sciacca
Current Estimated Value
Purchase Details
Closed on
Oct 19, 2009
Sold by
Sciacca Cheri L
Bought by
Sciacca Leonard M
Purchase Details
Closed on
Nov 2, 2004
Sold by
Sciacca Lenny
Bought by
Sciacca Leonard M and Sciacca Cheri L
Home Financials for this Owner
Home Financials are based on the most recent Mortgage that was taken out on this home.
Original Mortgage
$235,000
Interest Rate
5.7%
Mortgage Type
Stand Alone Refi Refinance Of Original Loan
Purchase Details
Closed on
Aug 13, 1996
Sold by
Digirolamo Mark
Bought by
Sciacca Leonard M and Sciacca Cheri
Purchase Details
Closed on
May 15, 1996
Sold by
Sciacca Cheri L
Bought by
Sciacca Leonard M
Create a Home Valuation Report for This Property
The Home Valuation Report is an in-depth analysis detailing your home's value as well as a comparison with similar homes in the area
Home Values in the Area
Average Home Value in this Area
Purchase History
| Date | Buyer | Sale Price | Title Company |
|---|---|---|---|
| Leonard Michael Sciacca Living Trust | -- | None Listed On Document | |
| Sciacca Leonard M | -- | None Available | |
| Sciacca Leonard M | -- | Fidelity National Title Co | |
| Sciacca Leonard M | -- | Old Republic Title Company | |
| Sciacca Leonard M | -- | -- |
Source: Public Records
Mortgage History
| Date | Status | Borrower | Loan Amount |
|---|---|---|---|
| Previous Owner | Sciacca Leonard M | $235,000 |
Source: Public Records
Tax History Compared to Growth
Tax History
| Year | Tax Paid | Tax Assessment Tax Assessment Total Assessment is a certain percentage of the fair market value that is determined by local assessors to be the total taxable value of land and additions on the property. | Land | Improvement |
|---|---|---|---|---|
| 2025 | $4,456 | $404,983 | $82,896 | $322,087 |
| 2024 | $4,456 | $397,043 | $81,271 | $315,772 |
| 2023 | $4,322 | $389,259 | $79,678 | $309,581 |
| 2022 | $4,121 | $381,627 | $78,116 | $303,511 |
| 2021 | $4,111 | $374,144 | $76,584 | $297,560 |
| 2020 | $4,089 | $370,308 | $75,799 | $294,509 |
| 2019 | $3,965 | $363,047 | $74,313 | $288,734 |
| 2018 | $3,867 | $355,929 | $72,856 | $283,073 |
| 2017 | $3,804 | $348,950 | $71,427 | $277,523 |
| 2016 | $3,747 | $342,107 | $70,026 | $272,081 |
| 2015 | $3,522 | $336,968 | $68,974 | $267,994 |
| 2014 | $3,522 | $319,000 | $80,000 | $239,000 |
Source: Public Records
Map
Nearby Homes
- 5525 W Perez Ave
- 5614 W Prospect Dr
- 5701 W Buena Vista Ave
- 1536 N Tamarack St
- 1617 N Aspen Ct
- 5721 W Prospect Dr
- 5235 W Pianosa Ct
- 5515 W Sunnyview Ave
- 5503 W Sweet Dr
- 4926 W Buena Vista Ave
- 1615 N Volterra Ct
- 6310 W Harold Ave
- 3010 N Monarch St
- 3018 N Monarch St
- 1401 W Payson Ave
- 2144 N Tommy St
- 2250 Hilton St
- 2250 N Hilton St Unit Syc29
- Carrera Plan at Sycamore Ranch
- Aspen with Loft Plan at Sycamore Ranch
- 1411 W Buena Vista Ave
- 5435 W Buena Vista Ave
- 5403 W Buena Vista Ave
- 1843 N Maselli Ct
- 1831 N Maselli Ct
- 5418 W Buena Vista Ave Unit TA
- 5418 W Buena Vista Ave
- 5430 W Buena Vista Ave
- 5408 W Buena Vista Ave
- 1834 N Salierno Ct
- 1848 N Salierno Ct
- 5440 W Buena Vista Ave
- 5400 W Buena Vista Ave
- 1912 N Maselli Ct
- 1912 N Maselli Ct
- 1850 N Maselli Ct
- 5448 W Buena Vista Ave Unit TA
- 5448 W Buena Vista Ave
- 1823 N Maselli Ct
- 1836 N Maselli Ct