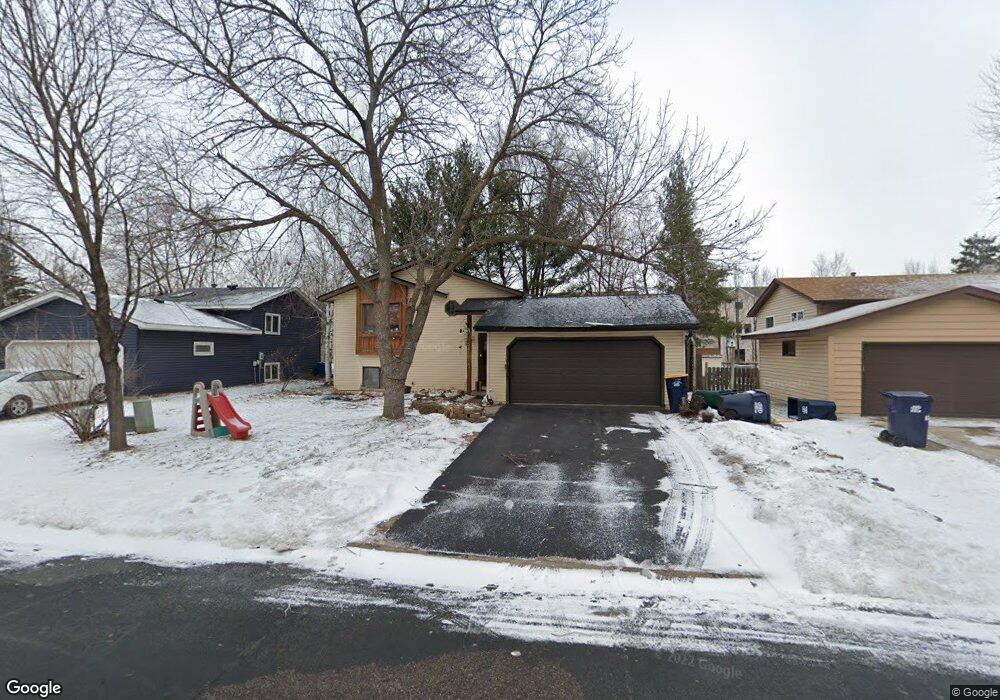
5419 180th St W Farmington, MN 55024
Estimated Value: $323,000 - $349,336
3
Beds
2
Baths
960
Sq Ft
$353/Sq Ft
Est. Value
About This Home
This home is located at 5419 180th St W, Farmington, MN 55024 and is currently estimated at $339,084, approximately $353 per square foot. 5419 180th St W is a home located in Dakota County with nearby schools including Meadowview Elementary School, Robert Boeckman Middle School, and Farmington High School.
Ownership History
Date
Name
Owned For
Owner Type
Purchase Details
Closed on
Nov 30, 2018
Sold by
Eagle Exteriors Inc
Bought by
Gierman Jeffrey A and Gierman Tracy P
Current Estimated Value
Home Financials for this Owner
Home Financials are based on the most recent Mortgage that was taken out on this home.
Original Mortgage
$194,298
Outstanding Balance
$73,819
Interest Rate
4.9%
Mortgage Type
Stand Alone Second
Estimated Equity
$265,265
Purchase Details
Closed on
Nov 2, 2018
Sold by
Dantzer Canda S
Bought by
Eagle Exteriors Inc
Home Financials for this Owner
Home Financials are based on the most recent Mortgage that was taken out on this home.
Original Mortgage
$194,298
Outstanding Balance
$73,819
Interest Rate
4.9%
Mortgage Type
Stand Alone Second
Estimated Equity
$265,265
Create a Home Valuation Report for This Property
The Home Valuation Report is an in-depth analysis detailing your home's value as well as a comparison with similar homes in the area
Home Values in the Area
Average Home Value in this Area
Purchase History
| Date | Buyer | Sale Price | Title Company |
|---|---|---|---|
| Gierman Jeffrey A | $202,900 | Partners Title Llc | |
| Eagle Exteriors Inc | $145,000 | Trademark Title Services Inc |
Source: Public Records
Mortgage History
| Date | Status | Borrower | Loan Amount |
|---|---|---|---|
| Open | Gierman Jeffrey A | $194,298 | |
| Closed | Gierman Jeffrey A | $194,298 | |
| Closed | Eagle Exteriors Inc | $108,750 |
Source: Public Records
Tax History Compared to Growth
Tax History
| Year | Tax Paid | Tax Assessment Tax Assessment Total Assessment is a certain percentage of the fair market value that is determined by local assessors to be the total taxable value of land and additions on the property. | Land | Improvement |
|---|---|---|---|---|
| 2024 | $3,546 | $296,900 | $69,700 | $227,200 |
| 2023 | $3,546 | $299,800 | $69,900 | $229,900 |
| 2022 | $3,342 | $302,100 | $69,700 | $232,400 |
| 2021 | $3,312 | $247,300 | $60,600 | $186,700 |
| 2020 | $3,250 | $243,500 | $57,700 | $185,800 |
| 2019 | $3,073 | $231,000 | $55,000 | $176,000 |
| 2018 | $2,919 | $216,300 | $52,300 | $164,000 |
| 2017 | $2,723 | $201,300 | $49,800 | $151,500 |
| 2016 | $2,499 | $185,100 | $47,400 | $137,700 |
| 2015 | $2,162 | $145,989 | $39,776 | $106,213 |
| 2014 | -- | $133,563 | $36,395 | $97,168 |
| 2013 | -- | $116,341 | $31,707 | $84,634 |
Source: Public Records
Map
Nearby Homes
- 18220 Empire Trail
- 17714 Everest Ave
- 17718 Everest Ave
- Shadowood Plan at Knob Hill - Villas
- Stonebrook Plan at Knob Hill - Villas
- 17725 Everest Ave
- 18231 Elkwood Ave
- 5695 Lower 182nd St W
- 17729 Everest Ave
- 5419 178th St W
- 17895 Eclipse Ave
- 17762 Empire Trail
- 17750 Empire Trail
- 17751 Empire Trail
- 17759 Embers Ave
- 18307 Euclid St
- 17703 Empire Trail
- 18325 Euclid St
- 17691 Empire Trail
- 5393 177th St W
- 5409 180th St W
- 5431 180th St W
- 5395 180th St W
- 5443 180th St W
- 5426 180th St W
- 17961 Equinox Ave
- 17957 Equinox Ave
- 17957 Equinox Ave
- 5387 180th St W
- 5394 180th St W
- 17965 Equinox Ave
- 5455 180th St W
- 18025 Emerald Trail
- 17969 Equinox Ave
- 18010 Empire Trail
- 5375 180th St W
- 18030 Emerald Trail
- 5380 180th St W
- 5467 180th St W
- 17799 Empire Trail