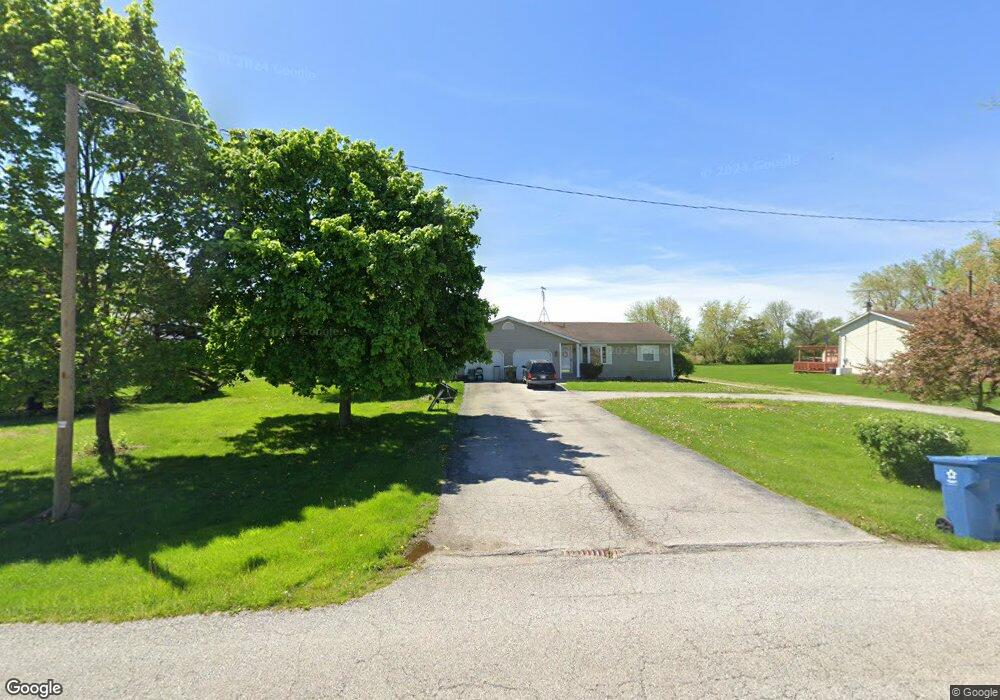
542-2 W 650 S Hebron, IN 46341
Porter County NeighborhoodEstimated Value: $307,775 - $395,000
5
Beds
2
Baths
2,040
Sq Ft
$171/Sq Ft
Est. Value
About This Home
This home is located at 542-2 W 650 S, Hebron, IN 46341 and is currently estimated at $347,944, approximately $170 per square foot. 542-2 W 650 S is a home located in Porter County with nearby schools including Hebron Elementary School, Hebron Middle School, and Hebron High School.
Ownership History
Date
Name
Owned For
Owner Type
Purchase Details
Closed on
Nov 21, 2025
Sold by
Cooper James W
Bought by
Woerner Catherine and Midkiff Ryan
Current Estimated Value
Home Financials for this Owner
Home Financials are based on the most recent Mortgage that was taken out on this home.
Original Mortgage
$229,500
Outstanding Balance
$229,500
Interest Rate
6.19%
Mortgage Type
New Conventional
Estimated Equity
$118,444
Create a Home Valuation Report for This Property
The Home Valuation Report is an in-depth analysis detailing your home's value as well as a comparison with similar homes in the area
Home Values in the Area
Average Home Value in this Area
Purchase History
| Date | Buyer | Sale Price | Title Company |
|---|---|---|---|
| Woerner Catherine | -- | Community Title |
Source: Public Records
Mortgage History
| Date | Status | Borrower | Loan Amount |
|---|---|---|---|
| Open | Woerner Catherine | $229,500 |
Source: Public Records
Tax History Compared to Growth
Tax History
| Year | Tax Paid | Tax Assessment Tax Assessment Total Assessment is a certain percentage of the fair market value that is determined by local assessors to be the total taxable value of land and additions on the property. | Land | Improvement |
|---|---|---|---|---|
| 2024 | $5,534 | $265,400 | $31,700 | $233,700 |
| 2023 | $5,851 | $275,500 | $30,200 | $245,300 |
| 2022 | $5,711 | $265,600 | $30,200 | $235,400 |
| 2021 | $4,799 | $209,800 | $30,200 | $179,600 |
| 2020 | $4,560 | $198,100 | $28,600 | $169,500 |
| 2019 | $4,390 | $191,700 | $28,600 | $163,100 |
| 2018 | $4,264 | $184,800 | $28,600 | $156,200 |
| 2017 | $4,350 | $185,500 | $28,600 | $156,900 |
| 2016 | $4,247 | $184,600 | $33,200 | $151,400 |
| 2014 | $3,974 | $176,000 | $31,900 | $144,100 |
| 2013 | -- | $178,900 | $34,200 | $144,700 |
Source: Public Records
Map
Nearby Homes