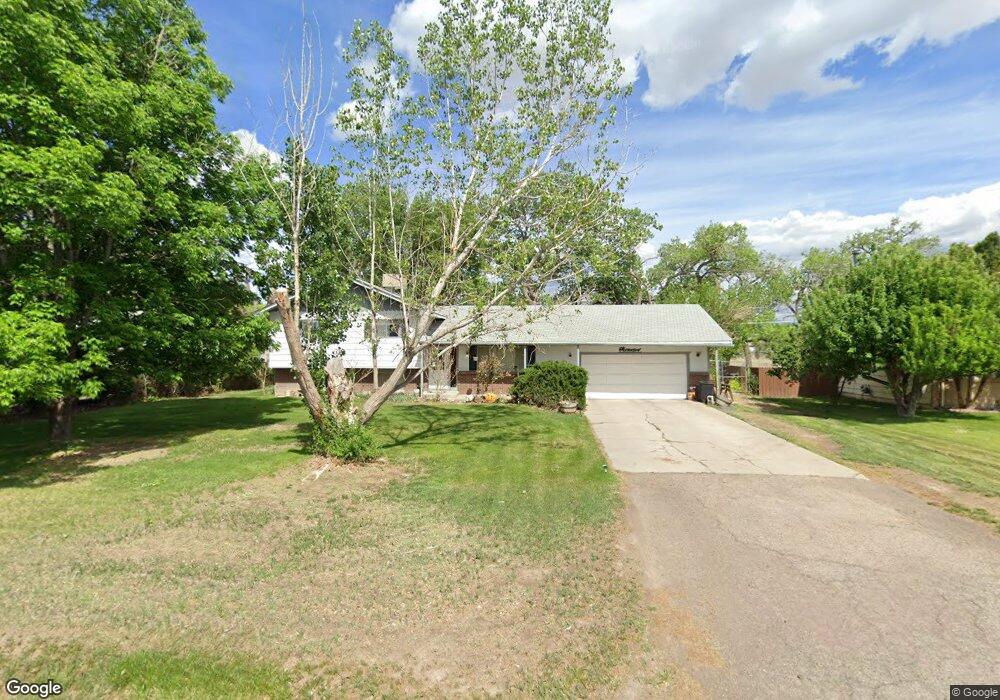
542 31 Rd Grand Junction, CO 81504
Estimated Value: $397,000 - $417,000
3
Beds
2
Baths
2,030
Sq Ft
$199/Sq Ft
Est. Value
About This Home
This home is located at 542 31 Rd, Grand Junction, CO 81504 and is currently estimated at $403,857, approximately $198 per square foot. 542 31 Rd is a home located in Mesa County with nearby schools including Fruitvale Elementary School, Grand Mesa Middle School, and Central High School.
Ownership History
Date
Name
Owned For
Owner Type
Purchase Details
Closed on
Oct 1, 1999
Sold by
Lovato Arnold Dean and Galland Lovato Kathryn
Bought by
Mcelwain Blake E and Mcelwain Sheri A
Current Estimated Value
Home Financials for this Owner
Home Financials are based on the most recent Mortgage that was taken out on this home.
Original Mortgage
$96,500
Outstanding Balance
$29,137
Interest Rate
7.83%
Estimated Equity
$374,720
Purchase Details
Closed on
Mar 31, 1998
Sold by
Kapple Monte D
Bought by
Lovato Arnold Dean and Galland Lovato Kathryn
Home Financials for this Owner
Home Financials are based on the most recent Mortgage that was taken out on this home.
Original Mortgage
$101,950
Interest Rate
7.04%
Purchase Details
Closed on
Jan 27, 1995
Sold by
Gillespie Mainard L
Bought by
Mcelwain Sheri A
Purchase Details
Closed on
Oct 14, 1992
Sold by
Barker Carl E
Bought by
Mcelwain Sheri A
Create a Home Valuation Report for This Property
The Home Valuation Report is an in-depth analysis detailing your home's value as well as a comparison with similar homes in the area
Home Values in the Area
Average Home Value in this Area
Purchase History
| Date | Buyer | Sale Price | Title Company |
|---|---|---|---|
| Mcelwain Blake E | $123,000 | First American Title | |
| Lovato Arnold Dean | $102,900 | -- | |
| Mcelwain Sheri A | $92,500 | -- | |
| Mcelwain Sheri A | $86,500 | -- |
Source: Public Records
Mortgage History
| Date | Status | Borrower | Loan Amount |
|---|---|---|---|
| Open | Mcelwain Blake E | $96,500 | |
| Previous Owner | Lovato Arnold Dean | $101,950 |
Source: Public Records
Tax History Compared to Growth
Tax History
| Year | Tax Paid | Tax Assessment Tax Assessment Total Assessment is a certain percentage of the fair market value that is determined by local assessors to be the total taxable value of land and additions on the property. | Land | Improvement |
|---|---|---|---|---|
| 2024 | $1,579 | $20,250 | $4,250 | $16,000 |
| 2023 | $1,579 | $20,250 | $4,250 | $16,000 |
| 2022 | $1,352 | $16,890 | $3,480 | $13,410 |
| 2021 | $1,358 | $17,380 | $3,580 | $13,800 |
| 2020 | $1,200 | $15,570 | $3,220 | $12,350 |
| 2019 | $1,142 | $15,570 | $3,220 | $12,350 |
| 2018 | $1,075 | $13,370 | $3,240 | $10,130 |
| 2017 | $1,047 | $13,370 | $3,240 | $10,130 |
| 2016 | $930 | $13,630 | $3,180 | $10,450 |
| 2015 | $942 | $13,630 | $3,180 | $10,450 |
| 2014 | $1,095 | $16,020 | $2,790 | $13,230 |
Source: Public Records
Map
Nearby Homes
- 3145 E 1 2 Rd Unit 3
- 3105 E 1 2 Rd
- 3145 E 1 2 Rd Unit 2
- 3145 E 1 2 Rd Unit Lot 4
- 3145 E 1 2 Rd
- 526 Sunburst Ct
- 3087 Cedar Dr
- 565 Eastbrook St
- 3086 Evanston Ave
- 559 Sun Valley St
- 3145 E 1 2 Road Lot 2
- 3145 E 1 2 Road Lot 3
- 426 Steven Creek St
- 3130 Brownie Cir Unit 36
- 522 Teague Ct Unit 56
- 3092 Hoisington Ave
- 3141 Brownie Cir Unit 17
- 566 Sol Ln
- 533 Fruitwood Dr
- 3142 Grama Ave