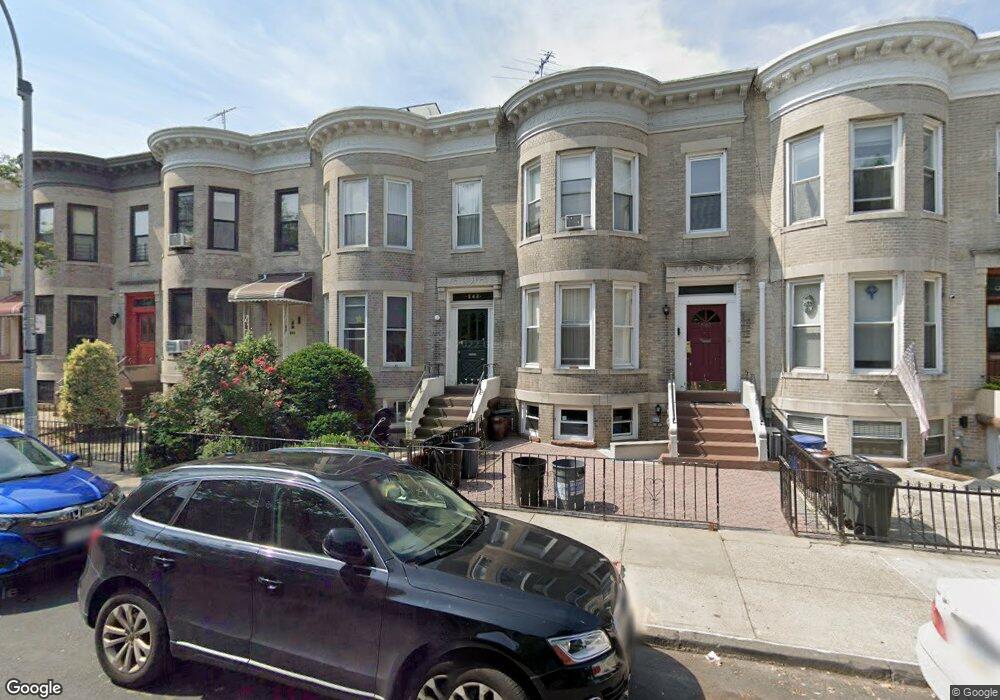
542 73rd St Brooklyn, NY 11209
Bay Ridge NeighborhoodEstimated Value: $1,287,764 - $1,799,000
--
Bed
--
Bath
3,120
Sq Ft
$502/Sq Ft
Est. Value
About This Home
This home is located at 542 73rd St, Brooklyn, NY 11209 and is currently estimated at $1,565,691, approximately $501 per square foot. 542 73rd St is a home located in Kings County with nearby schools including Junior High School 259 William McKinley, Fort Hamilton High School, and St Ephrem School.
Ownership History
Date
Name
Owned For
Owner Type
Purchase Details
Closed on
May 20, 2015
Sold by
Mcgrath Eleanor A
Bought by
Rousou Karina and Rousou Zachary
Current Estimated Value
Home Financials for this Owner
Home Financials are based on the most recent Mortgage that was taken out on this home.
Original Mortgage
$814,788
Outstanding Balance
$631,306
Interest Rate
3.84%
Mortgage Type
Purchase Money Mortgage
Estimated Equity
$934,385
Purchase Details
Closed on
Sep 28, 2005
Sold by
Mcgrath Eleanor A
Bought by
Mcgrath Eleanor A
Create a Home Valuation Report for This Property
The Home Valuation Report is an in-depth analysis detailing your home's value as well as a comparison with similar homes in the area
Home Values in the Area
Average Home Value in this Area
Purchase History
| Date | Buyer | Sale Price | Title Company |
|---|---|---|---|
| Rousou Karina | $835,000 | -- | |
| Mcgrath Eleanor A | $150,000 | -- |
Source: Public Records
Mortgage History
| Date | Status | Borrower | Loan Amount |
|---|---|---|---|
| Open | Rousou Karina | $814,788 |
Source: Public Records
Tax History Compared to Growth
Tax History
| Year | Tax Paid | Tax Assessment Tax Assessment Total Assessment is a certain percentage of the fair market value that is determined by local assessors to be the total taxable value of land and additions on the property. | Land | Improvement |
|---|---|---|---|---|
| 2025 | $8,894 | $85,620 | $14,280 | $71,340 |
| 2024 | $8,894 | $77,880 | $14,280 | $63,600 |
| 2023 | $6,473 | $85,980 | $14,280 | $71,700 |
| 2022 | $5,899 | $70,380 | $14,280 | $56,100 |
| 2021 | $6,331 | $69,000 | $14,280 | $54,720 |
| 2020 | $4,089 | $83,640 | $14,280 | $69,360 |
| 2019 | $7,720 | $82,440 | $14,280 | $68,160 |
| 2018 | $7,158 | $35,112 | $8,390 | $26,722 |
| 2017 | $6,792 | $33,321 | $8,059 | $25,262 |
| 2016 | $6,661 | $33,321 | $8,890 | $24,431 |
| 2015 | $3,011 | $32,569 | $10,815 | $21,754 |
| 2014 | $3,011 | $30,753 | $11,371 | $19,382 |
Source: Public Records
Map
Nearby Homes